
Debugger is a built-in tool of the Designer. It helps to debug the program modules created during the application solution development. The debugger allows tracing the sequence of execution of script operators and viewing the values of variables.
Main debug capabilities
- debugging the applications executed on the remote computers available with protocol TCP/IP,
- debugging the code executed by the working process of 1C:Enterprise 8 server cluster; in this case, the through call stack is supported for the client and server as well as the through step-by-step debugging of the client and server;
- debugging the code executed in such types of connections as external connection, background job and WS-connection.
Breakpoints
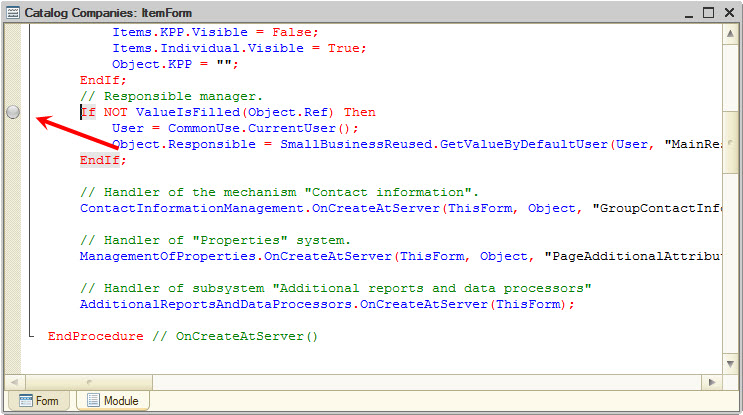
The debugger enables to set the special marker for a particular module line – a breakpoint, – when reaching which the execution of software module stops and the management is transmitted to the debugger. The breakpoints can be unconditional and conditional. When reaching the unconditional breakpoint, the execution of software module stops in any case:

When reaching the conditional breakpoint, the execution of software module stops only in case when the specified condition is true:

The debugger supports an ability to disable the breakpoints. In this case, the module line remains to be marked, but it does not affect on the progress of module execution:
With a large number of breakpoints it is comfortable to use a separate window to work with the breakpoints that allows viewing and editing them in a single list:

Single-stepping
After reaching the breakpoint, the management of application solution is given to the debugger and there is an ability of subsequent module execution in several modes: single-stepping, execution of function or procedure call, break of function or procedure single-stepping, module execution until the line on which there is a cursor or continuation of independent module execution:

Viewing expressions
During step-by-step execution, there is a possibility to view the values of variables contained in the module and to calculate the arbitrary values. To do this, a special window is used that displays the calculation result:

For the script objects the values of their properties are represented as a tree structure. For the values that are the strings, arrays and collections of values it is also possible to view in a separate window:

The current variable value can be viewed by moving the mouse pointer over this variable. The current value will be displayed as a short hint near the variable.
Immediate window
The calculation results that are required to view during the execution of some module part can be displayed in a separate window - immediate windiw, - in which there is an opportunity to distribute all the viewed expressions over the four pages:

Call stack
The debugger allows using the call stack which displays the call sequence of procedures and functions brought to the module line that is debugged at the moment:
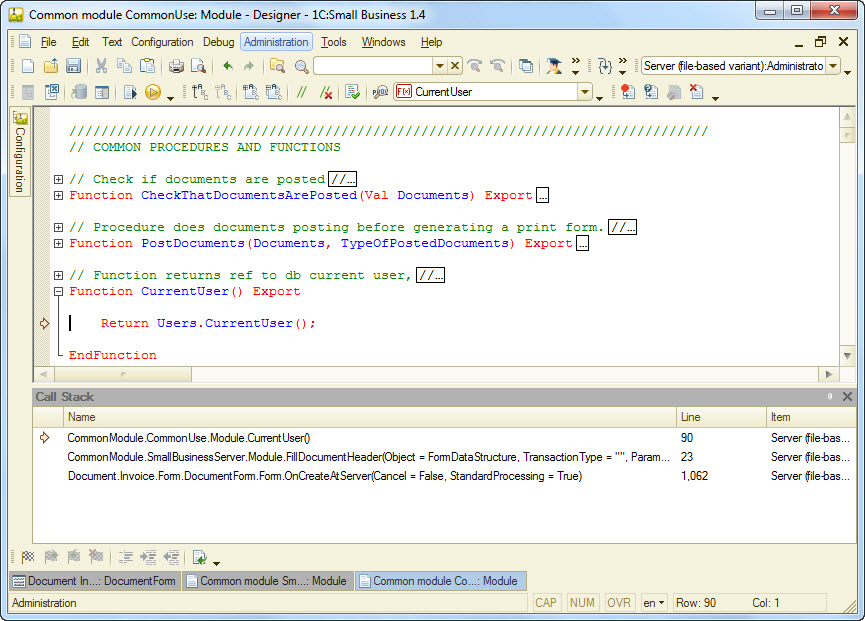
With double mouse clicking on the procedure name in the call stack, it is possible to go to the corresponding procedure line.
Stop on errors
The platform provides an ability to use the mode Stop on errors. In this mode the debugging can be stopped either with each occurred error or with an error in which text there is a substring specified by the developer. The substrings of errors of interest are defined in the debug settings.

During debugging with such setting, the debug will stop only when occurrence of the errors associated with division by zero.