
Adding a report
In Designer mode
Now you have everything you need to obtain some output data. Let us create a report that will display receipts, expenses, and the balance of materials (fig. 7.1).
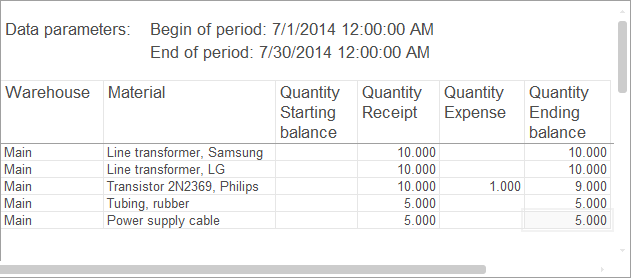
Fig. 7.1. Resulting report
Using this example, we will show how you can develop a report quickly and easily using only visual development tools and without writing any single script line.
Let us open your practice configuration in Designer and create a Report configuration object.
- In the configuration object tree, click the Reports branch.
- In the configuration window command bar, click the Add button
 (fig. 7.2).
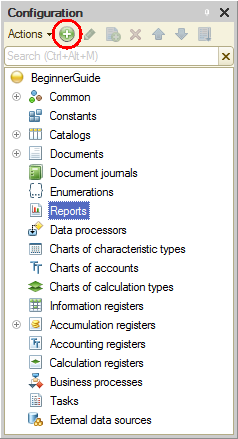
Fig. 7.2. Creating a Report configuration object - In the configuration object editor window, on the Main tab, in the Name field, type Materials.
Do not set other properties that define the object presentation in the applied solution interface. The platform will use the automatically generated synonym instead.
Next let us create the data composition schema, which serves as a basis for report generation. - Click Open data composition schema (fig.7.3).
-OR-
Click the Open button (fig. 7.3).
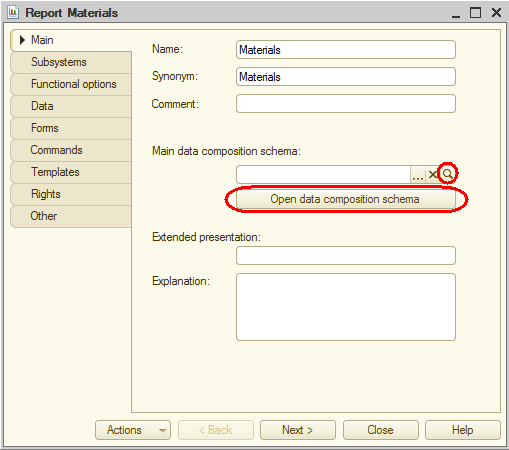
Fig. 7.3. Creating a data composition schema for a report
In 1C:Enterprise mode
Let us see how the report works.
- Start 1C:Enterprise in the debug mode.
You can see that the Accounting, Services, and Items sections now include the Reports menu, which contains the command that generates the Materials report (fig. 7.15).
Fig. 7.15.Command that generates the Materials report - Click the Materials command.
This opens an automatically generated report form. - Specify the beginning and end dates of the report period and click Create (fig. 7.16).
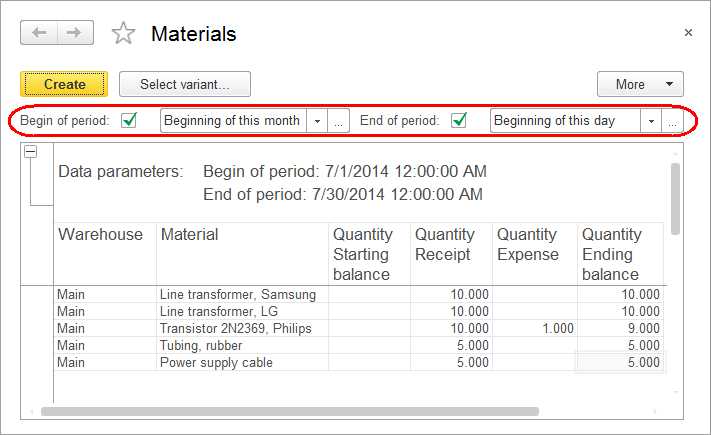
Fig. 7.16. Materials report
As you can see, the report looks good enough and fully reflects the movement of materials within your company.
Template
Since the report that you are creating does not have any data composition schema yet, the platform prompts you to create a schema. From the configuration perspective, a data composition schema is a template, and the platform opens the template wizard with the only template type available: Data composition schema (fig. 7.4).
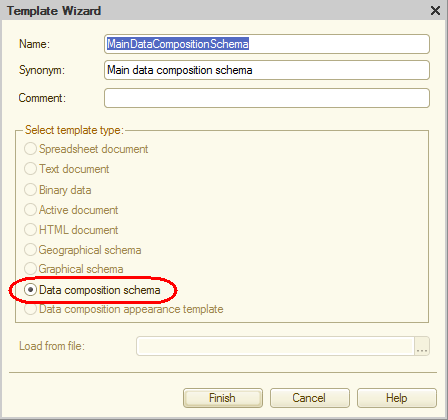
7.4. Creating a data composition schema for a report
- Click Finish.
Data composition schema
The platform creates a template that contains the data composition schema and then opens the data composition schema wizard.
The wizard provides a wide range of features for visual report design, but now you will use just a few basic features to specify the data that will be included in the report.
Data set
Let us add a data set (a query) to the data composition schema.
- Click the Add data set button
 (fig. 7.5) and then click Add data set - query.
-OR-
In the left pane, right-click Data Sets and then click Data set - query.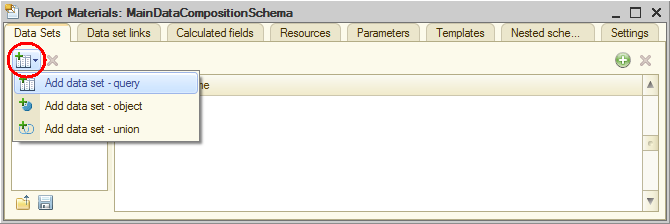
Fig. 7.5. Adding a data set in the data composition schema wizard
Query text
Let us create the query text.
- Click Query Builder (fig. 7.6).
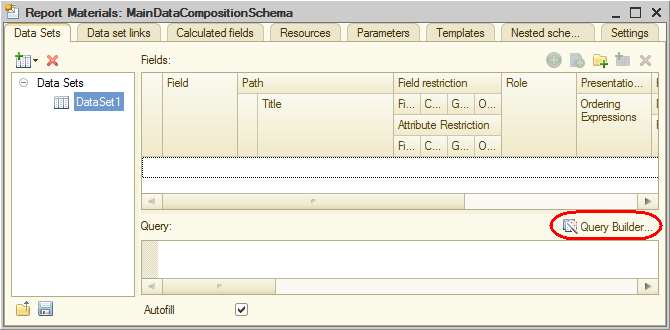
Fig. 7.6. Opening the Query builder
The Query builder is intended for generating queries using visual tools. Even users who are unfamiliar with the query language can use the wizard to generate valid queries.
The Database list displays the tables used to generate a query. The report is generated based on the data stored in these tables.
If you expand the AccumulationRegisters branch, you will see that, in addition to the BalanceOfMaterials register table, this branch contains several virtual tables that are generated automatically (fig. 7.7).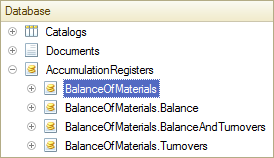
Fig. 7.7. Tables that you can use in a query
The register virtual tables are generated automatically, they are mainly used in report generation. Since we want to see both the balance of materials and information about material receipts and expenses, let us opt for the BalanceOfMaterials.BalanceAndTurnovers virtual table. - Drag the BalanceOfMaterials.BalanceAndTurnovers table to the Tables list and expand its structure (fig. 7.8).
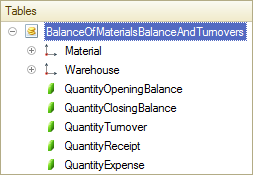
Fig. 7.8. The BalanceOfMaterials.BalanceAndTurnovers table
As you can see, this table contains the dimensions of the BalanceOfMaterials register (Material and Warehouse), the opening and closing balance, as well as receipt, expense, and turnover values for all the resources of the BalanceOfMaterials register.
Let us select the table fields in the required order. - Double-click the following items in the specified order:
- Warehouse
- Material
- QuantityOpeningBalance
- QuantityReceipt
- QuantityExpense
- QuantityClosingBalance
 ,
,  ,
,  , and
, and  buttons.
At this point the Fields list looks as follows (fig. 7.9).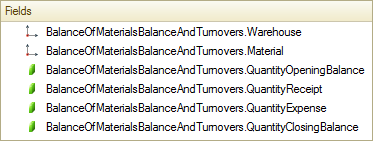
Fig. 7.9. Selected fields - Click OK to return to the data composition schema wizard (fig. 7.10).
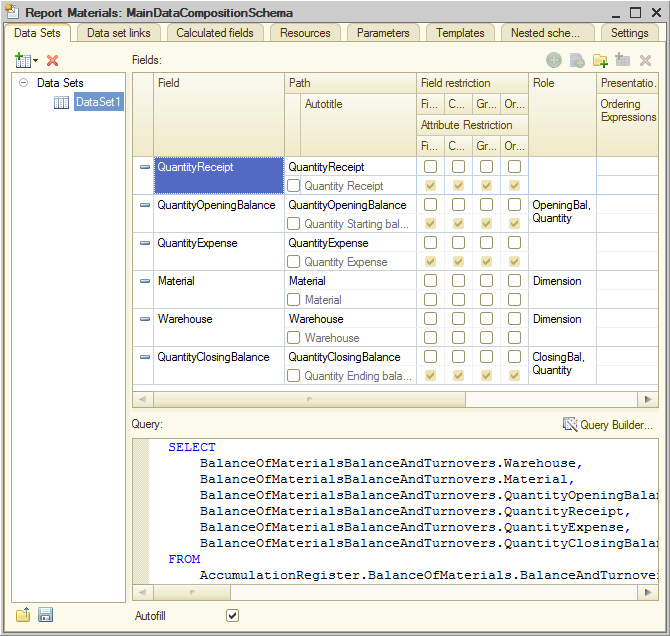
Fig. 7.10. Data composition schema wizard
The platform populates the Query field with the query text generated by the Query builder. This field is basically a text editor where you can edit the resulting query. Alternatively, you can reopen the Query builder and use it to edit the query.
To simplify things, we will not discuss the query text here. This aspect will be covered in Lesson 13. Reports (in the part dedicated to the query language). In this scenario (just like with many other reports) you can avoid analyzing and editing the query text.
Note the automatically populated list of data composition system fields in the upper part of the wizard window. It lists the fields available in the current data set. In this case the platform populated the list automatically based on the query text, so you do not need to adjust it manually.
So we have discussed how to extract data that is used in a report. But to have this data displayed in a report, you have to create the default report settings. Let us create simple report settings suitable for viewing typical detailed infobase records. These include the records of the BalanceOfMaterials accumulation register virtual table selected in the order that you used to add them into the table.
Report settings
Let us create the report settings.
- Click the Settings tab.
The upper right pane displays the hierarchical structure of the report. - Right-click Report and then click New grouping.
-OR-
In the command bar of the window, click the Add button and click New grouping.
-OR-
Click Report and then press Insert. - Do not enter the grouping field, simply click OK.
You have specified that the report includes detailed infobase records, that is, the records that are retrieved when a query is executed without totals (fig. 7.11).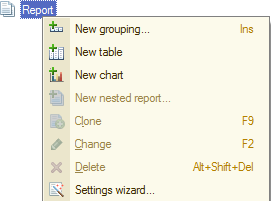
Fig. 7.11. Adding a grouping to a report
The Detailed records grouping is added to the report.
Now let us specify the fields that will be displayed in the report. - In the bottom pane, on the Selected fields tab, drag the following fields from the Available fields list to the Selected fields list:
- Warehouse
- Material
- QuantityOpeningBalance
- QuantityReceipt
- QuantityExpense
- QuantityClosingBalance
to the right of the list of selected fields. You can change the order of selected fields using the Move up  and Move down
  buttons or by dragging them.
Now the report settings window looks as follows (fig. 7.12).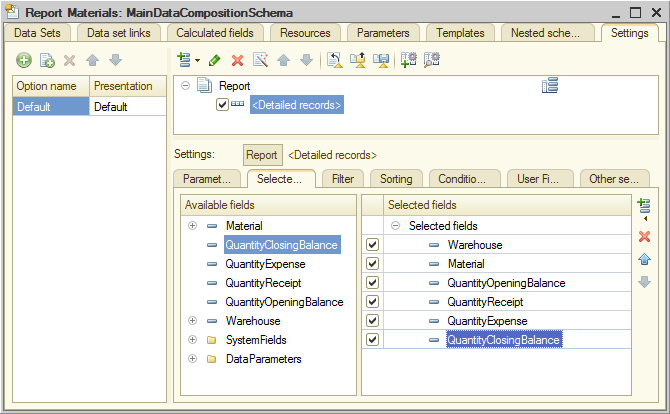
Fig. 7.12. Report settings window - In the bottom pane, click the Parameters tab.
Let us specify that the Begin of period and End of period report parameters are included in the list of custom settings and these settings are located directly in the report form (they will serve as quick settings). - In the lower pane, select the Begin of period and End of period check boxes.
The check boxes indicate that both parameters are used in the report. - For each parameter, select it, click the Custom settings item property button
 , and select the Include in custom settings check box (fig. 7.13).
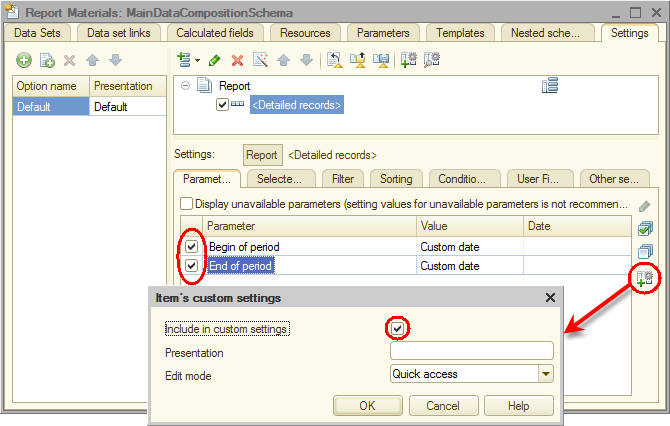
Fig. 7.13. Report settings window
So before a report is actually generated, a user can specify the report period. For detailed explanation of report parameters and custom settings, see Lesson 13. Reports.
Finally, let us specify the subsystems where the report is available. - Close the data composition schema wizard and then, in the editor of the Materials report configuration object, click the Subsystems tab.
- Select the Accounting, Inventory, and Services check boxes (fig. 7.14).
This adds the link that opens the report to the Reports menu in the command panels of these subsystems.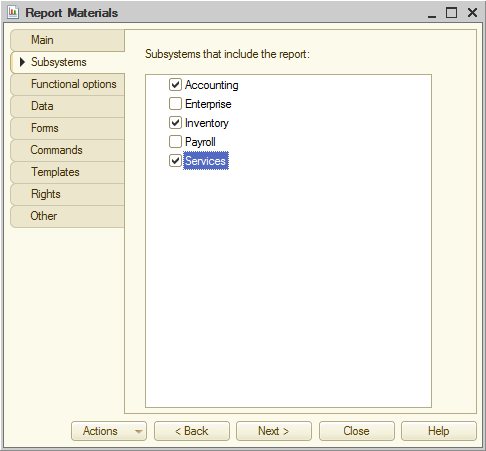
Fig. 7.14. Specifying the list of subsystems where a report is available