
Breaking down by days in the selected period
Let us add the next report: Revenue by technician.
This report displays the amount of revenue received by Jack of All Trades, Ltd. through the performance of each of its technicians, with a daily breakdown within a selected period and detailed data on the customers served during each of those days (fig. 13.57).
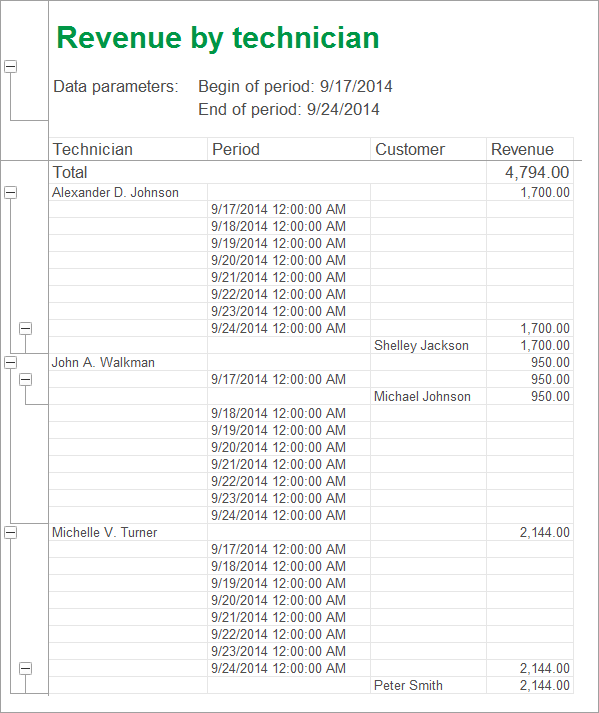
Fig. 13.57. Resulting report
Using this report as an example, we will show how to build multilevel groupings in a query and how to iterate through all the days of the selected period.
We will also show how to set up individual report structure items, export their data into a chart, and create multiple report options in Designer.
In Designer mode
Let us begin the report creation.
- Create a report configuration object named RevenueByTechnician.
- Run the Data composition schema wizard.
- Add Data set – query and run the Query builder.
- Select the Sales.Turnovers accumulation register virtual table as the data source.
In 1C:Enterprise mode
Let us check the report.
- Start 1C:Enterprise in the debug mode.
You can see that the Revenue by technician command is now available in the Reports menus of the Services and Payroll sections. - Click Revenue by technician, specify the report period between 9/17/2014 and 9/24/2014, and generate the report (fig. 13.70).

Fig. 13.70. Resulting report
If the report period is not important to users, they can clear the Begin of period and End of period check boxes. Then the report is generated based on all of the Sales register records available in the database (in this specific case this does not make any difference for the resulting report).
Breaking down by date within the selected period
At the beginning of the section we mentioned that this report should provide breakdown by date within a given period.
So far the report only displays the days that have nonzero records in the Sales accumulation register table.
For adding detailed data to the report, the data composition system features period completion for groupings with a specified periodicity within a specified time period.
So let us modify the report settings to include each day of the report period into the report.
Report options
To analyze technician performance over a specific period, you might want to have another view of that data. For example, when your CEO makes payroll decisions, they might want to see a chart displaying the share of each technician in the entire company’s revenue over a specific period to understand who works better.
Let us create a report option for the RevenueByTechnician report, which displays the data as a chart.
Query for a data set
Analyzing query text
Let us analyze the generated query text (listing 13.10).
Listing 13.10. Query text
SELECT
    SalesTurnovers.Technician,
    SalesTurnovers.Period,
    SalesTurnovers.Customer,
    SalesTurnovers.RevenueTurnover AS Revenue
FROM
    AccumulationRegister.Sales.Turnovers( , , Day, ) AS SalesTurnovers
Note that in the query description the periodicity of data selected from the data source is set to Day (listing 13.11).
Listing 13.11. Specifying virtual table periodicity
FROM
    AccumulationRegister.Sales.Turnovers( , , Day, ) AS SalesTurnovers
This is why you can use the Period field in the selection.
Resources
Let us proceed to editing the data composition schema.
- Click the Resources tab and click
 .
.
The wizard selects the only available resource: Revenue.
Parameters
Let us specify the data composition parameters, just like you did for the previous report.
- Click the Parameters tab.
- For the BeginOfPeriod and EndOfPeriod parameters, in the Type field, select Date and specify its format as Date.
- For the EndOfPeriod parameter, define the expression as shown in listing 13.12.
Listing 13.12. Expression for calculating the EndOfPeriod parameter valueEndOfPeriod(&EndOfPeriod,"Day")
Once you are done, the data composition parameters should look as shown in fig. 13.62.

Fig. 13.62. Data composition parameters
Settings
Let us specify the report structure.
You need two nested groupings for this report:
- Top-level grouping by Technician field
- Nested grouping by Period field
Let us create the groupings.
- On the Settings tab, in the command bar, click the Add
 button to add a grouping and then, in the Field field, select Technician and click OK (fig. 13.63).
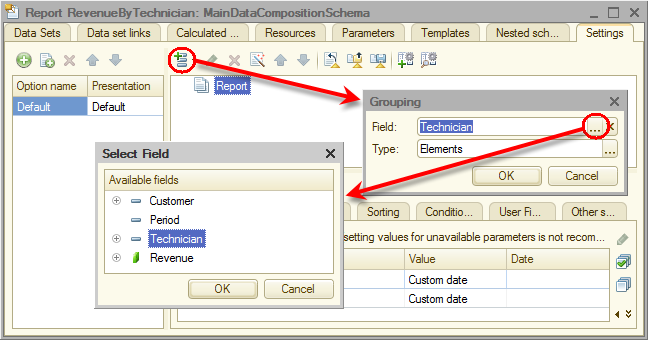
Fig. 13.63. Specifying the grouping field
Let us add the Period grouping that is subordinate to the Technician grouping. - Click the Technician grouping, click the Add button to add a grouping and then, in the Field field, select Period and click OK.
Then let us add the Detailed records grouping that is subordinate to the Period grouping (without selecting a grouping field). - Click the Period grouping, click the Add button to add a grouping, do not enter the grouping field, and click OK.
- Click the Selected fields tab and add Customer and Revenue to the list of selected fields.
You do not have to select the Technician and Period fields because these fields are used for grouping data, so their values are automatically displayed.
Once you perform these steps, the report structure should look as shown in fig. 13.64.
Fig. 13.64. Report structure and fields - Click the Other settings tab.
- In the Grouping field placement field, select Separately and only in totals.
By default grouping fields are arranged vertically in the report (fig. 13.65).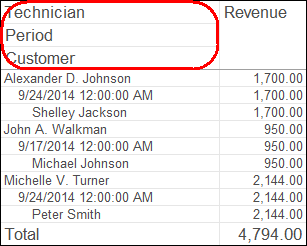
13.65. Default vertical arrangement of grouping and total fields
Selecting Separately and only in totals as the value for this property means that each grouping is located in a separate report area from left to right and its name is displayed only in this grouping (fig. 13.66).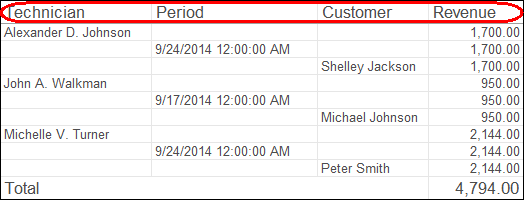
Fig. 13.66. Arrangement of grouping fields as Separately and only in totals - In the Vertical placement of overalls field, select Begin.
By default totals are located at the end of a vertical list (see fig. 13.66). Selecting this value for the property means that totals are displayed at the top, before the grouping rows (fig. 13.67).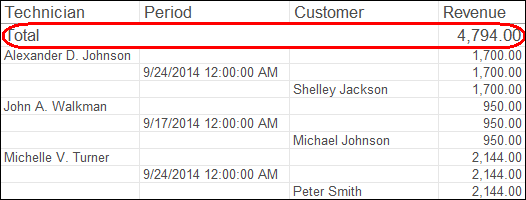
Fig. 13.67. Vertical arrangement with totals at the top
After these changes the report settings on the Other settings tab should look as shown in fig. 13.68.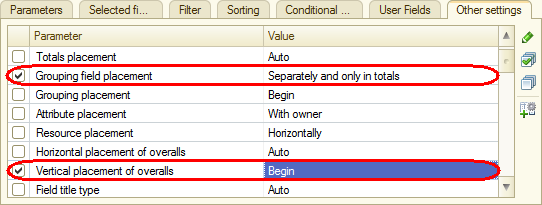
Fig. 13.68. Parameters of report display settings - In the Title field, type Revenue by technician.
- Specify that the Begin of period and End of period parameters are included in the list of user settings and displayed directly in the report form (in other words, they serve as quick settings).
It means that a user can define the report period before generating the report (fig. 13.69).
Fig. 13.69. Creating quick report period settings
Finally, let us specify the subsystems where the report is available. - Close the data composition schema wizard and then, in the editor of the RevenueByTechnician report configuration object, click the Subsystems tab.
- Select the Payroll and Services check boxes.
This adds the links that open the report to the Reports menus in the command panels of these subsystems.
In Designer
Let us fine-tune the report structure.
- In Designer, open the data composition schema, and click the Settings tab.
Up to this point all the structure settings that you implemented were applied to the entire report. But the data composition system features customization of each report structure item as well.
Important! When you customize the report settings, pay attention to the buttons in the middle of the window, under the report structure tree. When the Report button is selected, the customization applies to the entire report. When the button with a grouping name (such as Detailed records) is selected, the customization applies to the grouping.
Let us customize the settings for the Period grouping. - In the report structure tree, click the Period grouping and then click the Period button in the middle of the window, under the report structure tree.
The bottom pane displays the settings available for this grouping. - Click the Grouping Fields tab.
- For the Period field, set Addition type to Day (fig. 13.71).

Fig. 13.71. Specifying period completion type
This specifies that records with nonzero values available in this grouping are complemented by daily records.
Next let us specify the period where the completion is performed.
In the fields of the row below you can enter the beginning and end dates for this period. But specifying the dates explicitly does not suit our goal because a user might generate a report for a custom period. So we want the date completion to be applied to the report period selected by the user instead of some fixed period. - Double-click the Period start date field and then click the Clear
 button.
Then let us create the data type for this field. - Click the Select
 button, select Data composition field (fig. 13.72), and click OK.
Fig. 13.72. Selecting data type - Double-click the Period start date field, click the Select
 button, and then, in the Select Field window, select BeginOfPeriod (fig. 13.73) and click OK.
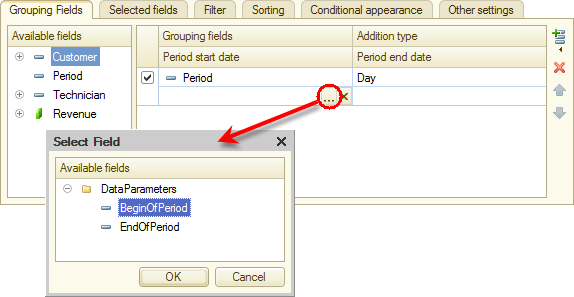
Fig. 13.73. Selecting field - In a similar manner specify that the period end date is obtained from the EndDate parameter (fig. 13.74).

Fig. 13.74. Specifying settings of the Period grouping
In 1C:Enterprise mode
Let us check the report.
- Run 1C:Enterprise in the debug mode and run the Revenue by technician report for the period from 9/17/2014 to 9/24/2014 (fig. 13.75).

Fig. 13.75. Resulting report
The resulting report displays the accumulation register data for the specified period broken down by date. The report includes the days when no services were rendered.
Charts
The Chart object is intended for displaying charts and diagrams in spreadsheets and forms.
Generally speaking, a chart consists of points, series, and series values in those points (fig. 13.76).
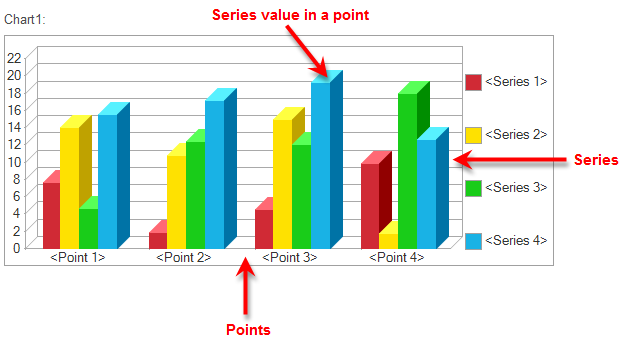
Fig. 13.76. Sample chart
As a rule, points represent moments of time or objects that have characteristics whose values you obtain, while series represent the characteristics. Chart values are located at intersections of series and points.
For example, a chart depicting monthly sales for service types consists of points (months), series (service types), and values (sales revenues).
The Chart 1C:Enterprise script object has three areas that define the chart appearance: the plot area, the header area, and the legend area (fig. 13.77).
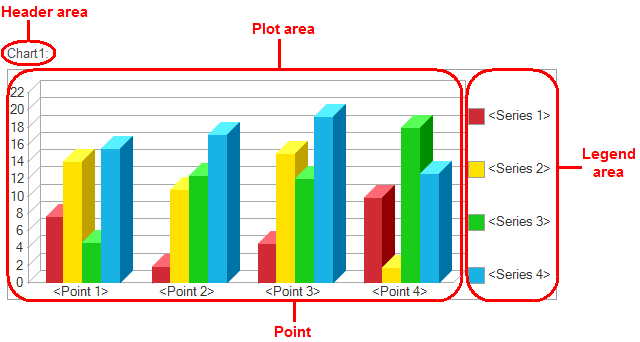
Fig. 13.77. Chart areas
You can add a chart as an independent report structure item. In the RevenueByTechnician report option you will include a chart in the data composition schema settings structure.
In Designer mode
Let us create a report option.
- In Designer, open the data composition schema, and click the Settings tab.
The left pane displays a list of report options.
When you first create report settings, the data composition system automatically creates the Default settings option. You can see this option in the list. Let us add another option. - Click the Add
 button above the list.
- For the report option name, type RevenueAmounts. For the report option presentation, type Revenue amounts (fig. 13.78).

Fig. 13.78. Adding a settings option
You can see that the report structure and all report settings are cleared.
But they are not gone. They are simply invisible because they belong to the Default settings option.
If a report has multiple options, you can only see and edit the settings for the currently selected option. And the other parts of the data composition schema (resources, parameters, and data sets) are not changed. The report data is obtained using the same database query. Only the settings that define the report view are different.
Let us add a chart to the report structure. - Right-click the Report root item and click New chart (fig. 13.79).
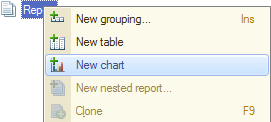
Fig. 13.79. Adding a chart to report structure - Click the Points branch and add a grouping by the Technician field to this branch.
A gauge chart is handy for displaying the share of each technician in the entire revenue amount. For this chart type it is enough to specify points, you do not have to specify series.
One or several report resources are always used as chart values. You have a single Revenue resource (the resource field is marked with a specific icon, so you can easily distinguish it from other fields). - Click the Selected fields tab and select the Revenue field to be displayed in the report.
The report structure should look as follows (fig. 13.80).
Fig. 13.80. Report structure and chart settings
Important! A chart must always display one or several report resources, otherwise it will return an error. - On the Other settings tab, select Gauge as the chart type (fig. 13.81).
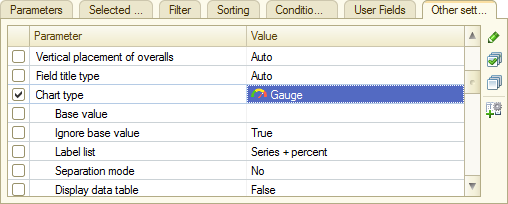
Fig. 13.81. Specifying chart type - Scroll down the list of gauge properties and define the gauge bands: Bad, Good, and Excellent (fig. 13.82).
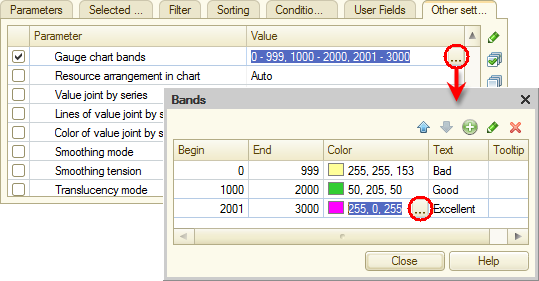
Fig. 13.82. Specifying gauge band settings - Include Begin of period and End of period to the list of user settings and set their Edit mode to Quick access.
Important! You have to specify the user settings for each report option independently because each option has its own user settings.
In 1C:Enterprise mode
Let us check the report.
- Run 1C:Enterprise in the debug mode.
- In the Payroll section, on the Reports menu, click Revenue by technician.
- Click Select variant (fig. 13.83).
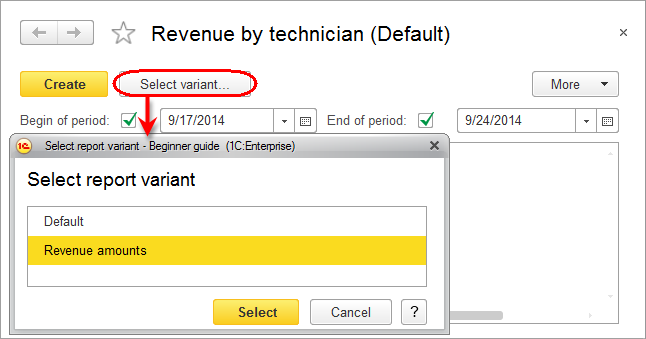
Fig. 13.83. Specifying report option
The Select report variant window contains two options: Default and Revenue amounts (which you have just created). - Click Revenue amounts and click Select.
- Click Create (fig. 13.84).

Fig. 13.84. Resulting report
This report option displays the same data as the default option but arranged as a gauge. The chart clearly displays the share of each technician in the entire revenue volume. Tooltips are available when you move the pointer over chart arrows.
Note that you have not specified the report period here, thus including all service-related data to the report. In a live system the number of documents is much greater than three, that is why you need the option to set the report period. For example, one might want to view monthly technician revenues.
But if you need to view data for a specific technician broken down by days and customers, it is sufficient to select the Default report option and generate the report.
In the Revenue by technician report development exercise you learned how to create and use report options to display technician performance data using the view that suits your needs best.
Virtual table parameters
Let us specify the Periodicity virtual table parameter.
- In the Tables field, click the SalesTurnovers table, and then click the Virtual table parameters
 button (fig. 13.58).
Fig. 13.58. Specifying virtual table parameters - In the Virtual table parameters window, set Periodicity to Day (fig. 13.59).

Fig. 13.59. Specifying virtual table parameters - Click OK.
- Select the following table fields (fig. 13.60):
- SalesTurnovers.Technician
- SalesTurnovers.Period
- SalesTurnovers.Customer
- SalesTurnovers.RevenueTurnover

Fig. 13.60. Selected fields - Click the Unions/Aliases tab and type Revenue as the alias for the SalesTurnovers.RevenueTurnover field (fig. 13.61).
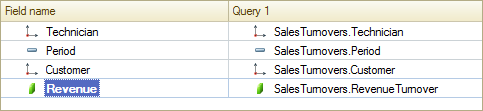
Fig. 13.61. Unions/aliases - Click OK.