
Displaying data as a spreadsheet
Let us create a general-purpose report. Using this report as an example, we will show how to output data to a table (fig. 13.108).
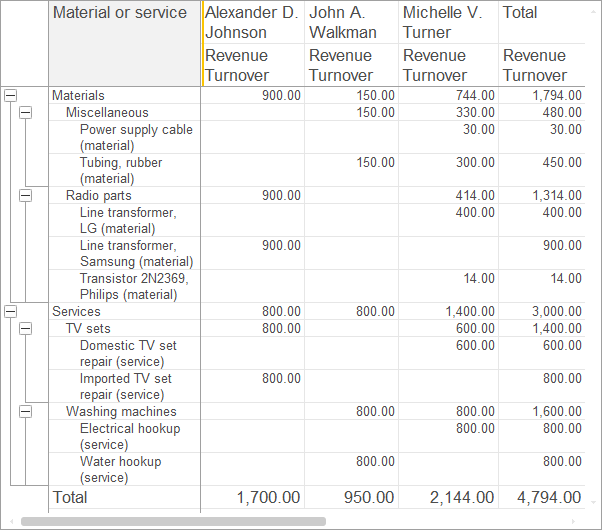
Fig. 13.108. Resulting report
We will show how to make a report as flexible as possible, so that users can edit the report structure and appearance in 1C:Enterprise mode without using the full report settings (the Select variant command on the More menu). For example, users can change the order of spreadsheet columns and rows or change the data displayed in spreadsheet cells.
In Designer mode
Let us begin the report creation.
- Create a report configuration object named GenericReport.
- Run the Data composition schema wizard.
- Add Data set – query and run the Query builder.
In 1C:Enterprise mode
Let us check the report.
- Run 1C:Enterprise in the debug mode.
- In the Services section, on the Report menu, click Generic report.
- Click Create.
You can see that the resulting report is empty because row groupings, column groupings, and the list of selected fields are empty. Let us specify these quick user settings. - In the Selection field, click the Select
 button and select Revenue Turnover.
- In the Rows field, click the Select button and add a grouping by the Material or service field with the Hierarchy type.
- In the Columns field, click the Select button and add a grouping by the Technician field.
- Click Create.
The report should look as shown in fig. 13.112.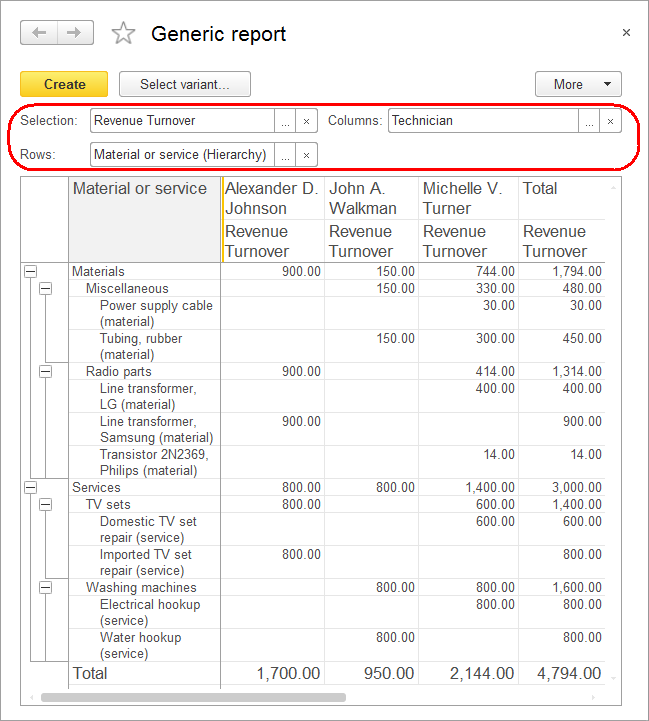
Fig. 13.112. Resulting report
Note that scrolling the report horizontally or vertically does not move the report header and its leftmost column. The platform automatically freezes the top and left report areas for usability purposes. Alternatively, you can specify the rows and columns to freeze using the FixLeft and FixTop output parameters. - Add Cost Turnover to the list of selected fields.
- Change the row grouping from Material or service to Customer and create the report.
The report should look as shown in fig. 13.113.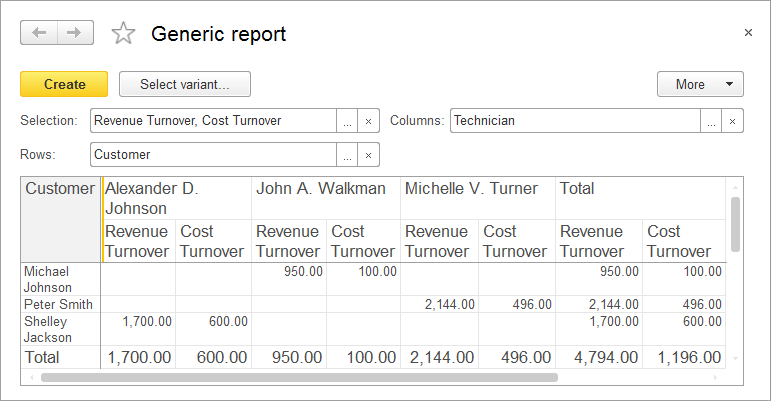
Fig. 13.113. Resulting report - Exclude Cost Turnover from the list of selected fields.
- Change the row grouping to Material or service with the Hierarchy only type.
- Add a column grouping by the Customer field, move it to the beginning of the grouping list, and click Create.
The report should look as shown in fig. 13.114.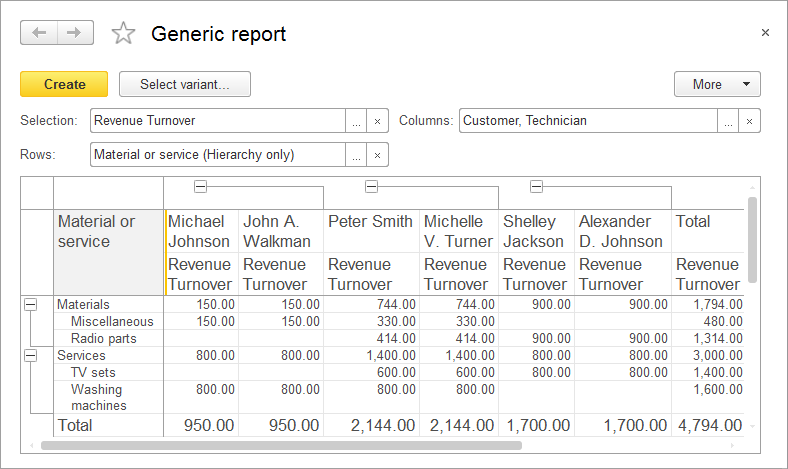
Fig. 13.114. Resulting report
So you have created a report that offers users the option to create a variety of custom reports based on the Sales register.
Query for a data set
Let us specify the query data set.
- Select the Sales.Turnovers virtual table as the data source.
- Select all fields from this table (fig. 13.109).

Fig. 13.109. Selected fields - Click OK.
Analyzing query text
Let us check the generated query text (listing 13.15).
Listing 13.15. Query text
SELECT
    SalesTurnovers.MaterialOrService,
    SalesTurnovers.Customer,
    SalesTurnovers.Technician,
    SalesTurnovers.QuantityTurnover,
    SalesTurnovers.QuantityRevenue,
    SalesTurnovers.CostTurnover
FROM
    AccumulationRegister.Sales.Turnovers AS SalesTurnovers
Resources
Let us add the resources.
- Click the Resources tab and click
 .
.
This adds all available resources.
Settings
Let us add a table to the report structure.
- On the Settings tab, in the command bar, click the Add
 button and then click New table (fig. 13.110).
Fig. 13.110. Adding a table to report structure
Let us skip specifying spreadsheet rows and columns and the list of selected fields because our goal is to provide users with full freedom in their actions. - In the report item structure, click the Table item and then click the Custom settings item properties
 button on the command bar.
This opens the window where you can edit the assortment of user settings for the spreadsheet. - Select the Selected Fields, String groupings, and Column groupings check boxes, and in the Edit mode column, leave their default Quick access values (fig. 13.111).
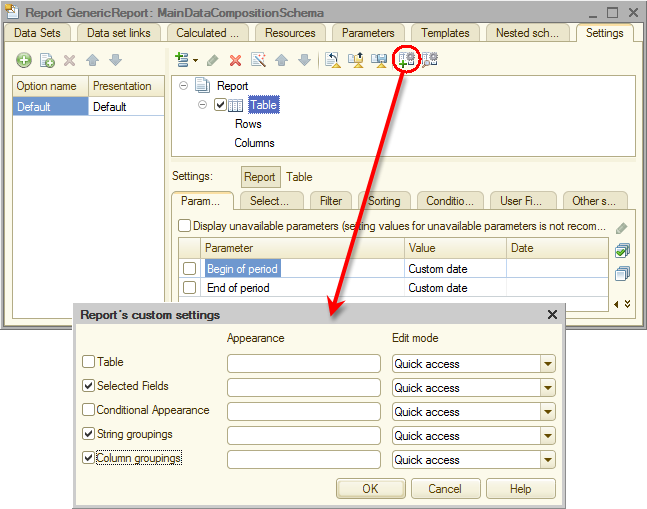
Fig. 13.111. Editing user settings
So you gave users the option to define the assortment of selected fields, as well as spreadsheet row and column groupings, directly in the report form prior to report generation.
Finally, let us specify the subsystems where the report is available. - Close the data composition schema wizard and then, in the editor of the GenericReport configuration object, click the Subsystems tab.
- Select the Services check box.