
Selecting data from two tables
The Service evaluation report displays the most profitable services for Jack of All Trades within a given period (fig. 13.18).

Fig. 13.18. Resulting report
Using this report as an example, we will show how to select data within a given period, how to set query parameters, how to use data from multiple tables in a query, and how to include all the data from a single source to the query result.
You will also learn how to work with data composition system parameters and how to use default dates, and you will familiarize yourself with quick user report settings.
Finally, you will learn more about the report filter and conditional appearance settings.
In Designer mode
Let us proceed to report creation.
- Create a report configuration object named ServiceEvaluation.
- Run the Data composition schema wizard.
- Add Data set – query and run the Query builder.
In 1C:Enterprise mode
Let us check the report.
- Start 1C:Enterprise in the debug mode.
You can see that the Reports menus of the Accounting and Services sections now include the command that generates the Service evaluation report (fig. 13.40).
Fig. 13.40.Command that generates the Service evaluation report - Click Service evaluation.
This opens an automatically generated report form.
The report window displays the parameters that define the report period. The default period is from the beginning of the month till the current date. You can change this period by clicking the calendar button. - Click Create (fig. 13.41).

Fig. 13.41. Service evaluation report
As you can see, the revenue for the services listed in all three Services documents is included in the report because the document dates fit the specified period.
Note that the report header displays the title that you specified and the parameters that define the report period.
Also note that the header position remains fixed when you scroll down the report. The platform automatically freezes the top rows of the report spreadsheet document. You can also specify the freeze settings for report rows and columns manually using the Fix left and Fix top output parameters.
The service names (the Ref field of the MaterialsAndServices catalog) include both the item name and the item type because you specified this format for their presentations. - Change the end date to 9/20/2014.
You can see that only data of the Services document #1, which is created on September 17th, is now included in the report (fig. 13.42).
Fig. 13.42. Report execution result
So the data as of the last date of the report period is included in the report, exactly as you specified earlier using the EndOfPeriod() function.
Note that since the report query links the materials and services table to the sales register table using left join, the services that do not have any sales data are still displayed in the report.
Settings in Designer and settings in 1C:Enterprise mode
Using this report as an example, we will show how to create and use the following report settings: Conditional appearance and Filter.
You will create these settings in Designer and then switch to 1C:Enterprise mode to check the result. But actually all the settings that you specify in Designer are available in 1C:Enterprise mode. When a user clicks Change variant on the More menu, they see a report settings window that is very similar to the Settings tab of the data composition schema.
But these settings are not the same as Designer settings. The settings specified in Designer are the default settings, they are stored in the data composition schema itself, in other words, they are a part of the configuration. Any configuration user will see the report layout exactly as you have specified it in Designer.
The same settings are available in 1C:Enterprise mode but they are not a part of the configuration. They are only available to a single user of a specific infobase, the one who specifies them.
Note. You can implement a settings exchange between the configuration users. But this is not a simple task and we will not discuss it in this book, just know that this option is available.
The report options feature in 1C:Enterprise mode is not intended for regular users (quick settings and user settings are sufficient for them). Instead, this feature is intended for configuration developers, administrators, or advanced users.
It is obvious that the settings applied in 1C:Enterprise mode override the default settings. If a user changes the report, making it totally different from the original version, they can always return to the default settings using the Standard settings command on the More menu.
Since right now we want to customize the report for all the users who will have access to it, let us do it in Designer.
But if one day the chief accountant asks you to make a "better-looking" report, you will be able to customize the report at their workstation, without modifying the configuration.
Query for a data set
Analyzing query text
Let us analyze the generated query text (listing 13.6).
Listing 13.6. Query text
SELECT
    MaterialsAndServicesCat.Ref AS Service,
    SalesTurnovers.RevenueTurnover AS Revenue
FROM
    Catalog.MaterialsAndServices AS MaterialsAndServicesCat
        LEFT JOIN AccumulationRegister.Sales.Turnovers AS SalesTurnovers
        ON SalesTurnovers.MaterialOrService = MaterialsAndServicesCat.Ref
WHERE
    MaterialsAndServicesCat.IsFolder = FALSE
    AND MaterialsAndServicesCat.MaterialServiceType = &MaterialServiceType
ORDER BY
    Revenue DESC
The query begins with a usual query description part, this time it contains statements you have not yet encountered.
The query source description (after the FROM keyword) specifies multiple sources (listing 13.7).
Listing 13.7 Multiple query sources description
FROM
    Catalog.MaterialsAndServices AS MaterialsAndServicesCat
        LEFT JOIN AccumulationRegister.Sales.Turnovers AS SalesTurnovers
        ON SalesTurnovers.MaterialOrService = MaterialsAndServicesCat.Ref
In this case records are selected from two sources (MaterialsAndServicesCat and SalesTurnover), while the LEFT JOIN … ON keywords describe how the records from these two sources are combined.
LEFT JOIN means that the query result includes a combination of records from both sources that satisfy the condition stated after the ON keyword. Additionally, the query result includes records from the first source (which is specified to the left of the JOIN keyword) that are not linked to any records that match the condition in the second source.
Let us review the next lines of the query text. In the query definition section there is one more statement that is new to you: specifying the filter conditions for source table data (listing 13.8).
Listing 13.8. Filter conditions
WHERE
    MaterialsAndServicesCat.IsFolder = FALSE
    AND MaterialsAndServicesCat.MaterialServiceType = &MaterialServiceType
A filter condition is always preceded by the WHERE keyword. The condition itself follows the keyword. Note that the source table fields that the condition is applied to do not have to be present in the selection list (this is the case here). And the condition includes the MaterialServiceType query parameter preceded by ampersand (&).
Now that we are done reviewing the query text, let us proceed to data composition schema generation.
Resources
The report should display the total revenue values for each service. For this you have to specify the report resource fields.
When we talk about resources in the data composition system, we refer to the fields whose values are calculated based on detailed records included in a grouping. Actually, resources represent group or overall totals of a report.
You can set up the totals on the Resources tab.
- Click the Resources tab and click
 .
.
This selects all of the resources whose totals are available for calculation. In this case you have a single Revenue resource. The platform suggests that you set up the totals calculation for values stored in this field and this is exactly what you need (fig. 13.28).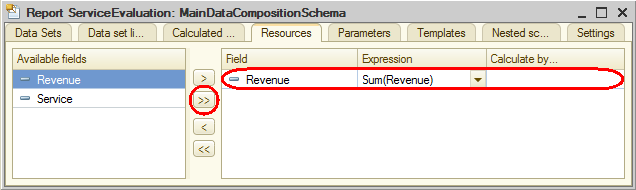
Fig. 13.28. Data composition schema resources
Parameters
A user is normally interested in economic activity data over a specific period. This is why almost any report includes parameters that specify the beginning and the end of the report period.
Report parameters specify the conditions for including records in the report. In the data composition schema you can define report parameters on the Parameters tab (fig. 13.29).

Fig. 13.29. Data composition parameters
The tab contains three parameters: BeginOfPeriod, EndOfPeriod, and MaterialServiceType. You might ask why you have three parameters here while you only specified one (MaterialServiceType) in the query.
The data composition system analyses query text on its own and in addition to the explicitly specified parameters (MaterialServiceType) provides the option to customize parameters of virtual tables that participate in the query.
This is the case for the BeginOfPeriod and EndOfPeriod parameters. They are the two first parameters of the AccumulationRegister.Sales.Turnovers virtual table, which is used in the query, in the left join.
If you select this table in the list of tables in the Query builder and then click the Virtual table parameters  button, a dialog box with the BeginOfPeriod and EndOfPeriod parameters is displayed (fig. 13.30).

Fig. 13.30. Virtual table parameters
The first parameter stores the beginning of the totals calculation period, while the second parameter stores the end of the period. So the source table contains only turnovers calculated for the specified period.
Remember that when you pass a date to any of these parameters (it is what you will do later in this example), the date includes time with a one-second precision.
Suppose that you know in advance that the user does not need the report results for periods specified in seconds. Then you have to do the following two things.
First, eliminate the need to enter time when a user enters report period dates. To implement this, let us modify the type definition for the BeginOfPeriod parameter.
- In the Data composition schema wizard, click the Parameters tab.
- For the BeginOfPeriod parameter, double-click in the Type cell.
- Click the Select
 button and then, in the Date format list, select Date.
- Click OK (fig. 13.31).

Fig. 13.31. Editing date format
Second, the default time value in a date is 00:00:00. If a user specifies a report period from 6/1/2014 to 6/11/2014, the register totals are calculated from the beginning of the day 6/1/2014 00:00:00 to the beginning of the day 6/11/2014 00:00:00. The data for the 11th day of the month that is not available at the beginning of the day is not included in the report, which might confuse users.
To eliminate this issue, let us add a new EndDate parameter for storing the end date entered by the user. And let us set up automatic calculation of the EndOfPeriod parameter, so that it points to the end of the day specified by the user.
- For the EndOfPeriod parameter, select the Availability restriction check box (fig. 13.32).

Fig. 13.32. Adding the EndDate parameter
When the check box is cleared, the parameter is available for user customization. And when the check box is selected, the parameter is hidden from the user interface. - Click the Add
 button in the command bar and add the EndDate parameter.
The platform automatically generates the End date title for this parameter. - For the EndDate parameter, set the type to Date, and then set Date format to Date, just like you did for the BeginOfPeriod parameter.
- For the BeginOfPeriod parameter, set the title to Beginning date.
Note that by default the added parameter is available to users (the Availability restriction check box is cleared). This is fine with us.
Then let us look at the EndOfPeriod parameter. You have selected its Availability restriction check box because you will implement the calculation of the parameter value based on the EndDate parameter value entered by the user.
Let us use the expression language of the data composition system for specifying the EndOfPeriod calculation formula. This language includes the EndOfPeriod() function, which gets a date that corresponds to the end of some period, for example, the end of the specified day. - For the EndOfPeriod parameter, in the Expression cell, type the expression shown in listing 13.9.
Listing 13.9. Expression for calculating the EndOfPeriod parameter valueEndOfPeriod(&EndDate,"Day")
Note. The expression language available in the data composition system is described in detail in the built-in help in Designer.To open the built-in help
- On the Help menu, click Help contents.
- In the help contents, open section 1C:Enterprise / Data Composition System / Data Composition System Expression Language.

Fig. 13.33. Composition system parameters
Finally, let us set up the MaterialServiceType parameter.
Since the report should display the revenue generated by sales of services only, the value of the MaterialServiceType parameter should not be edited by users. It should be specified directly in the composition schema as Enumeration.MaterialServiceType.Service.
For the MaterialServiceType parameter, the Availability restriction check box is selected by default, so you only need to specify the required value of the MaterialServiceTypes enumeration in the Value cell. - For the MaterialServiceType parameter, in the Value cell, click the Select button and select Service (fig. 13.34).

Fig. 13.34. Specifying MaterialServiceType parameter value
Settings
Let us specify the report structure.
- On the Settings tab, add a grouping without specifying the grouping field.
- On the Selected fields tab, select the Service and Revenue fields (fig. 13.35).

Fig. 13.35. Service evaluation report structure - On the Other settings tab, set the Title parameter to Service evaluation (fig. 13.36).

Fig. 13.36. Specifying report title
Note. To modify settings that require a value selection, double-click the Value field, click the Select button, and select a value from the list. Once you do, the usage check box is automatically selected. You can also select or clear the check box manually.
Quick user settings
Finally, let us give users the option to specify the report period prior to report generation. This means including the Beginning date and End date parameters to the list of user settings.
These settings should be available directly in the report form because users almost always specify the report period.
The Parameters tab lists the parameters that users can edit (those that have the Availability restriction check box cleared).
- For each parameter, select it, click the Custom settings item property
 button, select the Include in custom settings check box, and, in the Edit mode list, keep the default Quick access value (fig. 13.37).
Fig. 13.37. Specifying user settings
Note that the Include in custom settings check box means that this setting is available in a new window (2) that is opened when the user clicks Settings on the More menu (so this setting is available to users but not intended for frequent use, fig. 13.38).
Fig. 13.38. Quick (1) and regular (2) user settings
Setting Edit mode to Quick access means that this setting is also displayed directly in the report form (1). It is a quick user setting (the setting that users need frequently, almost every time the report is executed), so it should be always available.
Let us specify the default values for the beginning and end dates to improve the report usability. - Set Beginning date to Beginning of this month and set End date to Beginning of this day (see fig. 13.37).
This means that when the report is generated, the beginning and end dates of the report period change dynamically so that the report displays data from the beginning of the current month up to the current day and the user will probably never need to modify them manually.
Finally, let us specify the subsystems where the report is available. - Close the data composition schema wizard and then, in the editor of the ServiceEvaluation report configuration object, click the Subsystems tab.
- Select the Accounting and Services check boxes.
This adds the links that open the report to the Reports menus in the command panels of these subsystems (fig. 13.39).
Fig. 13.39. Specifying the list of subsystems where the report is available
Conditional appearance
When it comes to the Service evaluation report, it is convenient to highlight some report records. These can be the records that contain services with the lowest or the highest revenues, or based on some other condition.
User settings
Filter
Left join of two tables
Let us specify two tables as query data sources.
- Drag the MaterialsAndServices object (referential) table and the Sales.Turnovers accumulation register virtual table to the Tables list.
In order to avoid name ambiguity in the query, let us rename the MaterialsAndServices table. - In the Tables list, right-click MaterialsAndServices, click Rename Table, and set the table name to MaterialsAndServicesCat (fig. 13.19).

Fig. 13.19. Renaming a table in a query - Drag the following fields from these two tables to the field list:
- MaterialsAndServicesCat.Ref
- SalesTurnovers.RevenueTurnover (fig. 13.20)

Fig. 13.20. Selected fields - Click the Links tab.
Since the query includes multiple tables, you have to specify how they are linked to each other.
By default the platform creates a link using the MaterialsAndServices field. This means that the value of the MaterialOrService dimension of the Sales register is equal to a reference to an item of the MaterialsAndServices catalog. - Clear the All check box for the SalesTurnovers table and select the All check box for the MaterialsAndServicesCat table.
This is how you specify Left join as the link type. In other words, the query result will include all the records of the MaterialsAndServices catalog and those records of the Sales register that meet the link condition based on the MaterialOrService field.
So the query result will contain all of the services, and sales revenues will be available for some services. No revenue values are displayed for services that were not rendered within the selected period.
The following example visually describes how the two tables shown above are linked to each other (fig. 13.21).

Fig. 13.21. Links between the table records in the query
Once you complete the procedure described in this section, the Links tab should look as shown in fig. 13.22.

Fig. 13.22. Links between the tables
Record filter condition
Let us set a filter that excludes the folders of the MaterialsAndServices catalog from the report.
- Click the Conditions tab.
- Expand the MaterialsAndServicesCat table and drag its IsFolder field to the list of conditions.
- Select the Arbitrary check box for this condition and type the following text in the Condition column (listing 13.5).
Listing 13.5. Query conditionMaterialsAndServicesCat.IsFolder = FALSE
This is how you specify that only those records of the MaterialsAndServices catalog that are not folders are selected.
This condition can be visually described using the following example. On the left you see the source table of the MaterialsAndServices catalog while on the right you see the records that are selected from this table (fig. 13.23).
Fig. 13.23. Filtering material and service records in a query
The second condition should state that the selected items must be services. Such conditions are referred to as simple conditions. Let us create it. - Drag the MaterialServiceType field to the list of conditions.
The platform automatically creates a condition stating that the material or service type must match the value of the MaterialServiceType parameter.
Later, before the query execution, you will pass the Service enumeration value to the MaterialServiceType parameter.
This condition can be visually described using the following example. On the left you see the records of the MaterialsAndServices catalog filtered using the first condition. On the right you see the service records only (fig. 13.24).
Fig. 13.24. Filtering material and service records in a query
Once you complete the procedure described in this section, the Conditions tab should look as shown in fig. 13.25.
Fig. 13.25. Creating query conditions
Note. You can specify filters both in the query itself and in the report settings. The same is true for sorting and grouping. We recommend that you specify filters in queries when the records that do not meet the filter condition are definitely not needed in the report. We also recommend that you use sorting and grouping in the report settings to make the report more flexible.
Field aliases
Let us set an alias for the catalog item presentation (Ref field) and for the register field.
- Click the Unions/Aliases tab.
- In the Field name column, change Ref to Service and change RevenueTurnover to Revenue (fig. 13.26).

Fig. 13.26. Specifying query field aliases
Records order
Let us specify the order of report records.
- Click the Order tab and specify that the query result is ordered by the value of the Revenue field (fig. 13.27).

Fig. 13.27. Specifying the order of records in a query
This completes the query creation. - Click OK.
This returns you to the Data composition schema wizard.
In Designer mode
Let us implement conditional appearance.
- Return to Designer, open the data composition schema, and click the Settings tab.
- In the bottom of the window, click the Conditional appearance tab.
- Click the Add button on the right (fig. 13.43).

Fig. 13.43. Specifying conditional appearance settings
First let us specify the appearance, that is, how the fields are highlighted. - In the Format field, click the Select button, select red text color (see fig. 13.43), and click OK.
Then let us specify the condition when the appearance is applied (when the text turns red). - In the Condition field, click the Select button.
- In the Filter window, click the Add
 button and then click New item (fig. 13.44).
Note that each filter item specifies a single condition and you can add multiple conditions.
Fig. 13.44. Specifying conditional appearance settings - Specify the following filter values and then click OK:
- Left value = Revenue
- Comparison type = Less than
- Right value = 700
If you want to highlight the entire report row, you can leave this list blank.
Let us select the report fields to be highlighed. - In the Formatted fields cell, click the Select button and then, in the window that is opened, click the Add button to select the Service and Revenue fields, and then click OK (fig. 13.45).

Fig. 13.45. Specifying conditional appearance settings
Actually, in this case you can skip this step because Service and Revenue are the only report fields.
Finally let is specify a presentation for the conditional appearance. - In the Presentation cell, type Unpopular service (fig. 13.46).

Fig. 13.46. Specifying conditional appearance settings
"Unpopular service" is what users will see in their settings. So instead of the messy line "Revenue under 700…" users will see the human-readable text that you specify in the Presentation field.
You have defined a conditional appearance for the report where all the services with revenues under 700 dollars are considered unpopular and highlighted by red text color.
Let us add this condition to the user settings. - Click the Custom settings item property button, select the Include in custom settings check box, and then, in the Edit mode list, select Normal (see fig. 13.46).
So you included the conditional appearance in the regular user settings. Unlike quick settings, regular user settings are not available in the report form and can only be accessed in a new window that is opened by clicking Settings on the More menu. This is because such settings are used much less frequently than, for example, report period settings.
In 1C:Enterprise mode
Let us check the report.
- Start 1C:Enterprise in the debug mode and open the report.
- Set the End date to Beginning of this day and click Create (fig. 13.47).

Fig. 13.47. Report execution result
You can see that the services with revenues under 700 dollars are displayed in red. - On the More menu, click Settings.
This opens the window with user settings, which include the report period parameters and the conditional appearance setting for unpopular services. - Clear the Unpopular service check box, click Finish editing (fig. 13.48), and run the report.

Fig. 13.48. User settings window
You can see that the color highlighting disappeared. The Unpopular service setting is not available in the report form because you selected the Normal edit mode for it instead of Quick access.
But this conditional appearance setting is hardcoded, so that users can only choose between using and not using it. Normally it suits the needs of regular users.
You can offer greater flexibility for advanced users. For example, you can let them specify their own report settings, such as filters, sorting, or conditional appearance.
Let us try this.
In Designer mode
Let us add the user settings to the report.
- Return to Designer.
- In the report data composition schema, click the Settings tab.
This tab lists all of the report settings defined by the developer. Some of these settings can be available to users, so that they can create custom filters, conditional report appearance, and so on. - In the settings window command bar, click the Custom settings item properties button (fig. 13.49).

Fig. 13.49. List of user settings
In the window that is opened you can edit the assortment of user settings for the report. - Select the Filter and Conditional Appearance check boxes.
- For the filter and conditional appearance, set Edit mode to Normal.
So you have included the filter and conditional appearance settings in the user settings. The users can specify these settings in the window that is opened by clicking Settings on the More menu.
In Designer mode
Let us create a filter setting in the report.
- In the bottom of the Settings tab, click the Filter tab.
The list on the left contains available report fields - Expand the Service field and double-click the Parent field.
This moves the Parent field to the list of filter conditions on the right (fig. 13.50).
Fig. 13.50. Specifying filter settings
So you implemented the option to filter the report by service category, which is available to users in 1C:Enterprise mode.
In 1C:Enterprise mode
Let us check the report.
- Start 1C:Enterprise in the debug mode and open the report.
- On the More menu, click Settings.
The user report settings window now includes the Filter and Conditional Appearance settings that you have just implemented (fig. 13.51).
Fig. 13.51. User settings window
Actually, there are two conditional appearance settings in this window.
The first one is the Unpopular service setting that you implemented in Designer. And now that you have added a setting for general conditional appearance, you provided the user with the option to create any number of their own conditions for conditional appearance, just like you have done it in Designer. We will skip it now but you can try it yourself.
Let us specify the report filter to display only services related to washing machine installation. - In the user settings window, in the Filter field, click the Select
 button (see fig. 13.51).
In the Edit filter window that is opened you can see the filter condition that you created earlier in Designer. - In the Value cell, click the Select from list
 button, start typing Washing machines, and select the Washing machines item from the drop-down list (fig. 13.52).
Fig. 13.52. Specifying filter settings - Click OK.
You have defined a filter to display only services that have the Washing machines group of the Materials and services catalog as their parent. - In the user settings window, click Finish editing and then click Create to run the report (fig. 13.53).
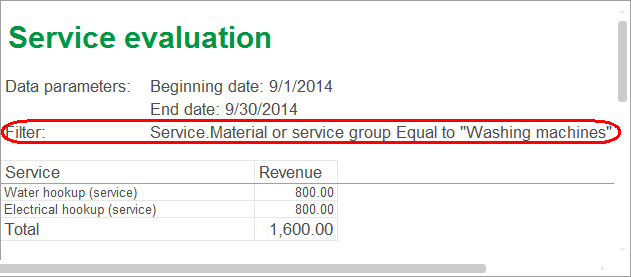
Fig. 13.53. Report execution result
You can see that the report lists only services related to washing machine installation and the report header includes the filter description.
When you close the report, the user settings are saved and they become the default report settings for the current user.
In the user settings window you can clear the filter by clicking the Clear  button, or you can create another condition by clicking the Select button in the Filter field (fig. 13.54).

Fig. 13.54. User settings window
So advanced users can customize a lot of settings. And if the users do not need this or do not have required skills, it is better to specify the settings explicitly, so that they can only enable or disable them.
In fact, often the users need just the report period and maybe a few other important settings, and such settings should be obviously located directly in the report form.
If the user priorities of settings usage are different from those implemented by the developer in the data composition schema, users can customize the settings by clicking Change settings assortment on the More menu (fig. 13.55).

Fig. 13.55. User settings of a report in 1C:Enterprise mode
In the Settings content window that is opened, a user can specify which settings are edited in the report form as quick settings (the list on the right) and which settings are available by clicking Settings on the More menu (the list on the left). They can use the Add and Remove buttons, as well as double-click the list items to move them between the lists.
- Move the filter setting to the quick settings list (fig. 13.56).

Fig. 13.56. Customizing the settings in 1C:Enterprise mode
The filter setting is now available directly in the report form. - Remove the filter setting from the report window, return to Designer, and clear the usage check box for the filter condition.
You will need this in the next examples.