
Theory. Data access methods
1C:Enterprise supports two methods of accessing data stored in a database:
- Object method (used for reading and writing)
- Table method (used for reading)
The object method involves 1C:Enterprise script objects. You have encountered some of these objects in the previous lessons.
An important feature of object data access method is that when you call a 1C:Enterprise script object, you call a data set stored in the database as a whole.
For example, the DocumentObject.Services object contains the values of all attributes and tabular sections of the Services document.
The object method features object caching, ensures object integrity and execution of appropriate event handlers, and so on.
The table method involves database queries that are written in the query language. You can use this method to access specific database table fields.
The table method is intended for retrieving data from the database based on certain conditions, such as filters, grouping, ordering, merging several selections, calculation of totals, and so on. The table method is optimized for processing large volumes of data stored in the database, and for obtaining data that matches specific criteria.
Using queries
Queries are based on the 1C:Enterprise script object named Query. It is intended for getting data stored in database fields in the form of selections based on the specified rules.
Data composition system
The data composition system is intended for creating custom reports in 1C:Enterprise system. It consists of several major parts.
A data composition schema stores the source data for report composition, which includes data sets and data processing methods (fig. 13.2).

Fig. 13.2. General data composition system flowchart
A developer creates a data composition schema, which includes the query text, data sets and connections between them, available fields, data access parameters, and also default composition settings, such as report structure or data appearance template.
For example, a composition schema can include a data set as shown in fig. 13.3.
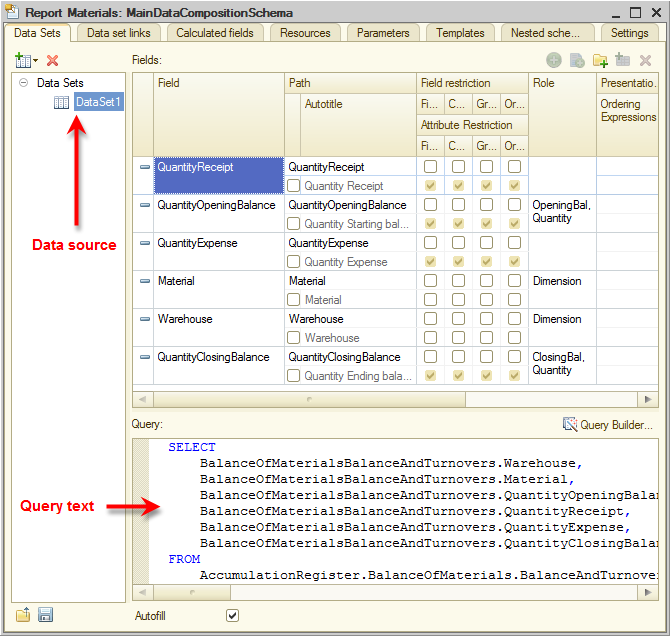
Fig. 13.3. Sample composition schema (a data set and a query that uses the set)
The figure shows the data composition schema wizard window, which contains the data source, the query text, and the fields selected by the query.
When a user runs a report based on the data composition system, what they get is not simply a table of records that satisfy the query conditions. A composition system report has a complex hierarchical structure, which can include a variety of items: groupings, tables, charts, and more.
A user can edit the report structure or create an entirely new report structure. A user can also customize the selection used in the report and the appearance of report structure items, view details of each item, and more.
For example, a report structure can include a single table and a single chart, as shown in fig. 13.4.
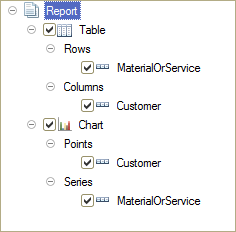
Fig. 13.4. Sample report structure
In this case the generated report looks as shown in fig. 13.5.

Fig. 13.5. Sample report
The sample report contains customer and service data from the SalesTurnover accumulation register, which is displayed as a table and as a chart.
As we have mentioned earlier, the data composition system is an aggregate of multiple objects. When a user runs a report, data is transferred consecutively from one data composition system object to another until the resulting report (a document displayed to the user) is generated.
The interaction between the objects is based on the following algorithm:
- A developer creates a data composition schema and the default settings. Usually a single data composition schema can serve as a basis for a large variety of reports, while data composition settings (either created by a developer or modified by a user) define the report layout.
- The template composer creates a template based on the composition schema and available settings. This step is a preparation for report execution. A data composition template is a complete assignment for the composition processor. It includes the required queries, report area templates, and more.
- The data composition processor selects data from the infobase based on the composition template, then aggregates and arranges that data.
- The output processor processes the composition result and the user obtains the resulting spreadsheet document.
This algorithm can be presented as a flowchart (fig. 13.6).

Fig. 13.6. Flowchart of composition system operations
Query data sources
Queries obtain their source data from a set of tables. These tables provide data from actual database tables in a form that is convenient for analysis.
All the tables that can be accessed using the query language can be divided into two large groups: actual tables and virtual tables (fig. 13.1).
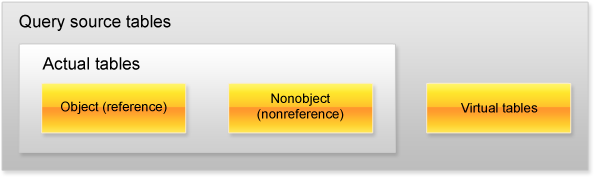
Fig. 13.1. Query tables
You can view the assortment of tables that can be accessed using queries along with their descriptions in the Syntax Assistant, in section Working with queries / Query tables.
Each actual table contains data from a single database table.
For example, the Catalog.Customers actual table corresponds to the Customers catalog, while the AccumulationRegister.BalanceOfMaterials table corresponds to the BalanceOfMaterials accumulation register.
Virtual tables are usually generated based on data available in multiple database tables. For example, AccumulationRegister.BalanceOfMaterials.BalanceAndTurnovers is a virtual table that is generated based on multiple tables of the BalanceOfMaterials register.
In some cases virtual tables can be generated based on a single actual table (for example, the Prices.SliceLast virtual table is generated based on the Prices information register table).
However, all the virtual tables share one common feature: they can be assigned a number of parameters that define which data is included in these tables. The assortment of parameters may vary for different virtual tables, it is defined by the data stored in the source database tables.
There are two actual table types: object (referential) and nonobject (nonreferential). Object (referential) tables store data of referential types: catalogs, documents, charts of characteristic types, and so on. Nonobject (nonreferential) tables store all the other data types: constants, registers, and so on.
The distinctive feature of object (referential) tables is the fact that they contain the Ref field, which is linked to the current record. You can obtain user object presentations from such tables as well. These tables can be hierarchical and their fields can include nested tables (tabular sections).
Query language
The algorithm that selects data from query source tables is defined using the query language.
A query text can include several parts:
- Query definition
- Query union
- Ordering query result
- Autoordering
- Description of totals
The only mandatory part is the first one, the query definition. All the other parts are optional.
A query definition specifies data sources, selection fields, groupings, and so on.
A query union specifies how the results of several queries are merged.
Ordering query result specifies how query result rows are ordered.
Autoordering enables automatic ordering of query result rows.
Description of totals specifies which totals are calculated in the query and how the results are grouped.
Note that when the query language is used to describe data sources in the data composition system, the description of totals query part is not used because the data composition system calculates the totals on its own based on the settings provided by the developer or by the user.
The query language syntax structures are described in detail in the built-in Designer help.
To open the built-in help
- On the Help menu, click Help contents.
- In the help contents, open section 1C:Enterprise / Script / Working with queries.
Another source of information about query language syntax is chapter "Work with Queries" of the 1C:Enterprise Developer Guide.
We will discuss the query language in more detail later, during the creation of specific reports.
You will not create any queries manually. For the majority of reports developed using the data composition system, you can create a query using the query wizard.
Your goal for this lesson is to learn how to read and understand query text, so that you can edit queries in the future.