
Using calculated fields in reports
Let us create the next report: Profit by customer. It visualizes the lifetime profit of Jack of All Trades by customer (fig. 13.99).

Fig. 13.99. Resulting report
Using this report as an example, we will show how to use calculated fields and how to display a report as a pie chart and as a bar chart.
In Designer mode
Let us begin the report creation.
- Create a report configuration object named ProfitByCustomer.
- Run the Data composition schema wizard.
- Add Data set – query and run the Query builder.
In 1C:Enterprise mode
Let us check the report.
- Run 1C:Enterprise in the debug mode.
- In the Accounting section, on the Reports menu, click Profit by customer.
- Click Create.
You can see that the profit generated by rendering services to specific clients is displayed as a pie chart (fig. 13.106).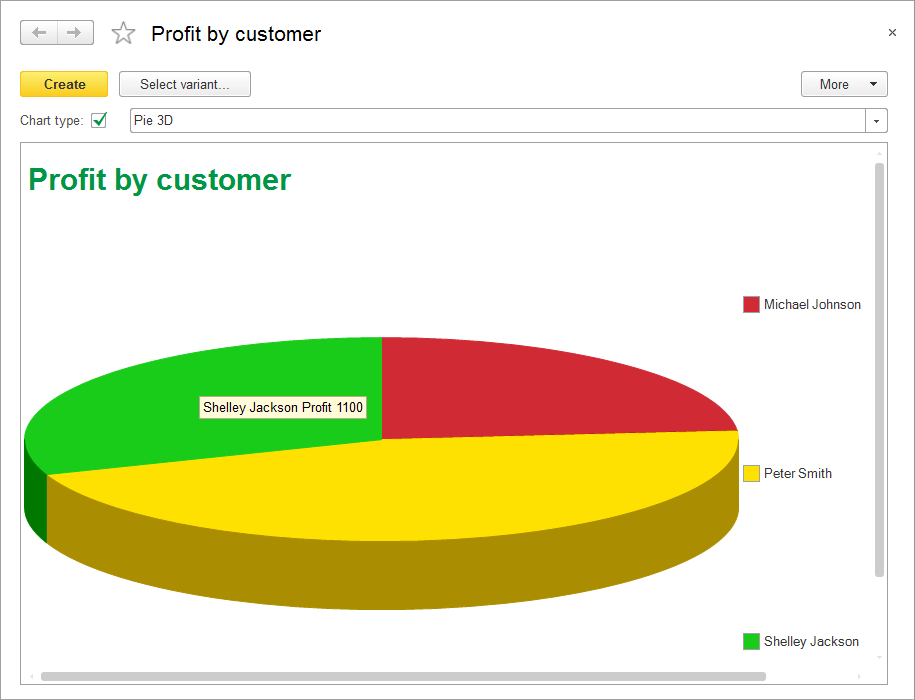
Fig. 13.106. 3D pie chart - In the report form, change Chart type to Column 3D and create the report.
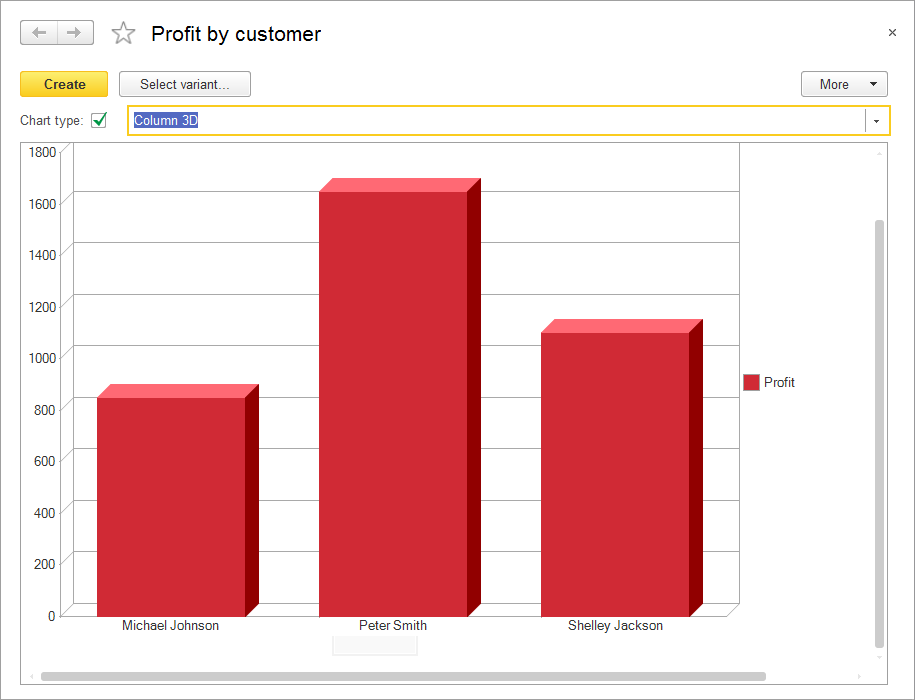
Fig. 13.107. 3D column report
So we have shown how you can use various chart types for viewing report data.
Query for a data set
Let us specify the query data set.
- Select the Sales.Turnovers virtual table as the data source.
- Select the following fields from this table (fig. 13.100):
- SalesTurnovers.Customer
- SalesTurnovers.RevenueTurnover
- SalesTurnovers.CostTurnover

Fig. 13.100. Fields selected for the query - Click the Unions/Aliases tab.
- Change RevenueTurnover to Revenue and change CostTurnover to Cost.
- Click OK.
This completes the query creation. Since the query contains only expressions that you already know, we will not explain it in detail. Let us proceed to editing the data composition schema.
Calculated fields
This is the first time you need to display a field that is not available in the data set. Previously you always used fields defined in the data sets. To display the profit for rendered services by customer, you need an additional field calculated as revenue minus service cost.
For this purpose the data composition system provides the option to define a calculated field.
Calculated fields are additional data composition schema fields whose values are calculated according to the specified formula.
- Click the Calculated fields tab.
- Click the Add
 button.
This adds a calculated field. - In the Data path column, type Profit.
- In the Expression column, type the expression for calculating the field value (listing 13.14).
Listing 13.14. Expression for calculating the Profit field valueRevenue - Cost
The platform fills the calculated field title (which is displayed in the report) automatically, you have the option to change it (fig. 13.101).
Fig. 13.101. Creating a calculated field
You can add a calculated field to report resources in order to calculate group and overall totals by this field.
Resources
Let us add the resources.
- Click the Resources tab and click
 .
.
You can see that the calculated field is included in the list of resources (fig. 13.102).
Fig. 13.102. Data composition schema resources
Settings
Let is add a chart to the report structure.
- On the Settings tab, in the command bar, click the Add
 button and then click New chart (fig. 13.103).
Fig. 13.103. Adding a chart to report structure - Click the Points branch and add a grouping by the Customer field to this branch.
Keep the chart series unchanged. A pie chart is perfect for displaying profit by customers and this chart type only requires specifying points, so you do not have to specify series.
The chart values always represent one or several report resources. - Click the Selected fields tab and include the Profit field in the report.
The report structure should look as shown in fig. 13.104.
Fig. 13.104. Report structure and chart settings - Click the Other settings tab, set Chart type to Pie 3D and include Chart type in the list of quick user settings (fig. 13.105).
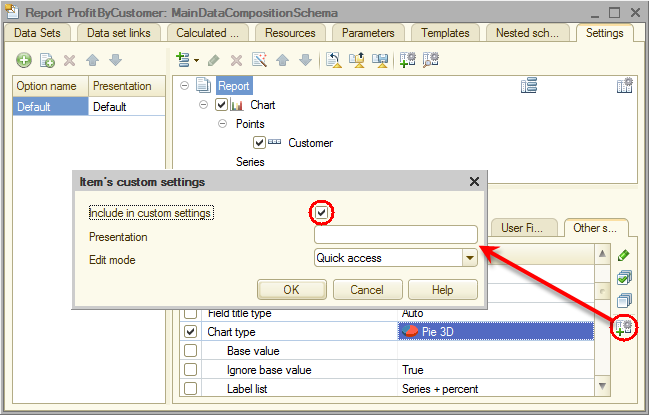
Fig. 13.105. 3D pie chart - Enter the Profit by customer report title.
Finally, let us specify the subsystems where the report is available. - Close the data composition schema wizard and then, in the editor of the ServiceList report configuration object, click the Subsystems tab.
- Select the Accounting and Services check boxes.