

“1С:Enterprise 8″ system contains a built-in debugger of software code.
Debugger is a special Designer tool which allows you to analyse the work of software code. This article considers some opportunities of debugger which are often used by developers.
To analyse software code using the debugger, a special tool is used which is called break point.
Breakpoint is a place to stop the system operation in the software code marked by a special marker:

When reaching breakpoint, you can execute the software code step-by-step and analyse the values of variables.
Setting breakpoints
Breakpoint is set on a specific line of software code by double-clicking the left mouse in the left area of software code that is grayed out.
You can also set breakpoint using the command Breakpoint in the Designer toolbar or using a button F9. The existing breakpoint is removed in the same manner.
To set breakpoint at the end of procedure of function, it is required to set breakpoint on the key word EndProcedure or EndFunction.
Breakpoint can be temporarily disabled without removing it from software code. To disable breakpoint, execute the command “Toggle breakpoint off” on the toolbar or press the key combination Ctrl+Shift+F9.
To view all breakpoints, it is required to execute the main menu command Debug – Breakpoint list or press the key combination Alt+F9. in the opened form Breakpoints you can temporarily disable or remove breakpoints:

To remove all breakpoints, you need to execute the command of Designer main menu Debug – Clear all breakpoints.
Conditional breakpoint
Conditional breakpoint is required to stop execution of software code when reaching specific condition.
To set the conditional breakpoint, execute the command of Designer main menu Debug – Conditional breakpoint. The form Breakpoint condition will be opened. In the input box you need to enter the required condition (for example, the value of some variable of software code) and click the button ОК.
After starting the system in debug mode, breakpoint will be triggered when the stop condition will be satisfied. You can verify this by using the form Immediate window. Manipulation with the form Immediate window will be considered below.

To begin debugging the software code, you need to set breakpoint and run the application in debug mode. To start debugging, you need to executed the command of Designer main menu Debug – Start debugging (F5).
After running the application in debug mode, it is required to provide activation of breakpoint. Here different scenarios are possible. For example, breakpoint is set in the module of document form in the standard event handler OnOpen(). in this case, breakpoint as activated when opening the form of any document in the user mode.
Breakpoint can be set in arbitrary procedure or function created by developer. In this case, breakpoint will be reached after calling this procedure or function from specific line of software code.
After breakpoint is reached, the system stops execution of software code and it becomes possible to use different debug functions such as: stepping through the software code, use of the form Immediate window, etc.
Stepping through the software code
To execute the software code step-by-step, the commands are used available in the Designer main menu in the menu Debug. For these commands it is convenient to use hot keys.
Step in (F11). If the next statement of software code calls the procedure or function, its single-step execution is performed, otherwise – the next statement is executed.
Step over (F10). If the next statement of software code calls the procedure or function, its complete execution without entering inside is performed. Then the next statement is executed.
Go to cursor (Shift+F10). Execution of statements is performed from the currently executed line to the software code line where the cursor is located.
Use of forms Immediate Window and Evaluate Expression
To view the values of variables and calculations of the values of expressions during a stop of software code, the forms Immediate Window and Evaluate Expression are designed.
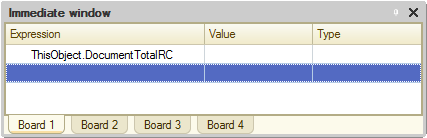
Form Immediate Window is called using the command of Designer main menu Debug – Immediate Window or with key combination Ctrl+Alt+W. In Immediate Window you can write the values of some variables and analyse how they change during software code execution.
In Immediate Window there four tabs. By default, the tabs are disabled. To enable the tabs, you need to call in the form Immediate Window the context menu and set the flag Tabs.
To calculate the values of expressions at the moment of software code stop, the form Evaluate Expression is used. To open this form, the command of Designer main menu is used Debug – Evaluate Expression or key combination Shift+F9.
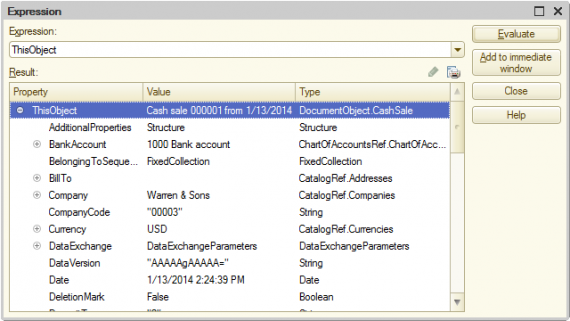
In the field Expression a script expression is entered. The expression value can be obtained by clicking the button Evaluate. The field Result outputs the value of expression. Expression can be displayed in the panel by clicking the button Add to immediate window.
To view collection values (for example, table of values, value list, array)m you can use the command Show values in separate window or key F2.
viewing call stack
Call stack is a form that allows you to track the mutual calls of procedures and functions during execution of software code. Call stack is displayed by the command of Designed main menu Debug – Call stack or using the key combination Ctrl+Alt+C. From the form Call stack you can go to the corresponding procedure of function.

Stop software code by error
During execution of software code the errors may occur that lead to a fail-stop of application. To configure an opportunity to stop the software code at the line where an error occurred, the form Stop on error is used.
To open the form, you need to executed the command of Designed main menu Debug – Stop on error.

It is required to set the flag Stop on error in the form and run the application in debug mode. Execution of software code will be stopped at the line where an error occurred.
Using the opportunities of debugger described in this article, the developer can analyse both his own software coda and the software code of standard solutions provided by “1С” company.
As practice shows, the search of errors in software code without debugger takes a long time. Therefore, it should be given a special attention to learn the debugger.