
1C:Enterprise 8.3. User Manual. Taxi Interface. Contents
CHAPTER 6. EDITING A REPORT VARIANT
It is only recommended to edit report variants for experience users familiar with report setup in the data composition system. To edit the report type, use the More – Change variant command.
This will open a report variant form.
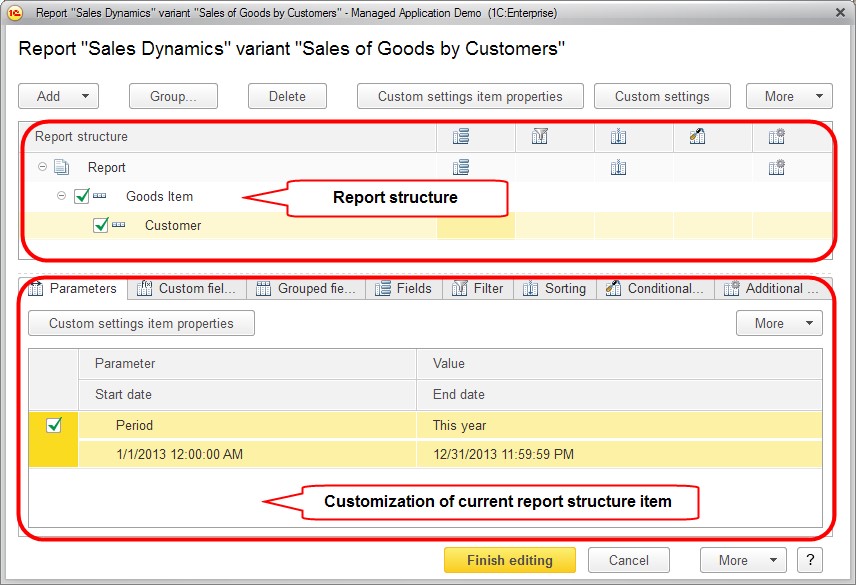
Fig. 109. Report variant setup form
The process of report variant customization is the process of changing report structure and selecting required parameters, creating custom fields, specifying fields to group by, to filter by and to sort by for every report item.
At any moment you can return an edited report customization variant to the initial view using More – Default settings.
More – Save settings is intended to save report settings to a file.
You can load settings from a file using More – Load settings. Settings are loaded in compliance with the access rights of the current user.
The Change form command of the More menu is designed to edit the form of report variant customization itself. For details on form customization, see "Form Setup" on the page 142.
6.1. GENERAL REPORT CUSTOMIZATION
To apply settings to the entire report, select the node Report in the report structure as shown on fig. 110. The assortment of settings (and their respective tabs) depends on available fields and selected customization item.
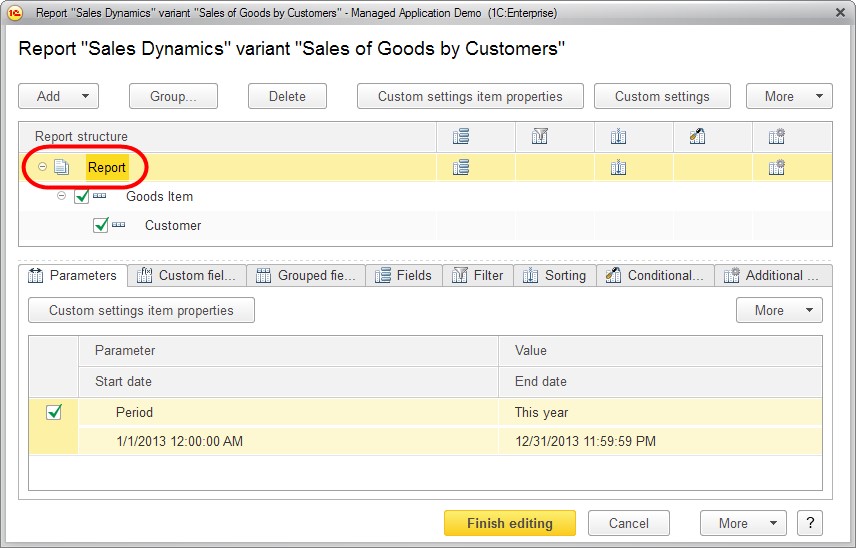
Fig. 110. Report variant customization
6.2. CHANGING REPORT STRUCTURE
In the data composition system report items may include groups, table, chart, and a nested report.
Grouping – displays data as a list. To add a grouping to a report, select Add – New Grouping or press Insert. In the window that opens select a field to group by and the type of grouping as shown below:
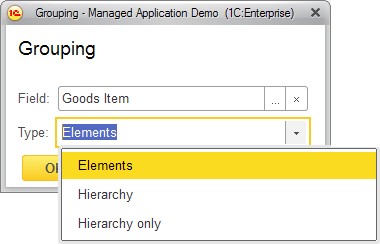
Fig. 111. Grouping customization form
If no field to group by is selected, the report will have detailed records added. These are the records obtained from the database ordered same as they are in the database.
In the simplest case when you add a grouping by the field Goods the report will look as shown below.
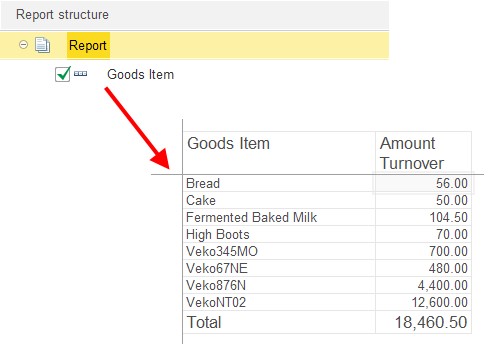
Fig. 112. Grouping in a report
TIP
You can also select structure elements that should be joined into groups and use More – Group.
The Ungroup command removes a grouping but keeps its content.
Table – displays data as a table. To add a table to the structure, select Add – New table. Groupings are used for rows and columns of such a table.
For example, a report structure may have a table created where the list of goods will serve as its rows while the columns will display data on the balance of goods in the warehouse (see the picture below).
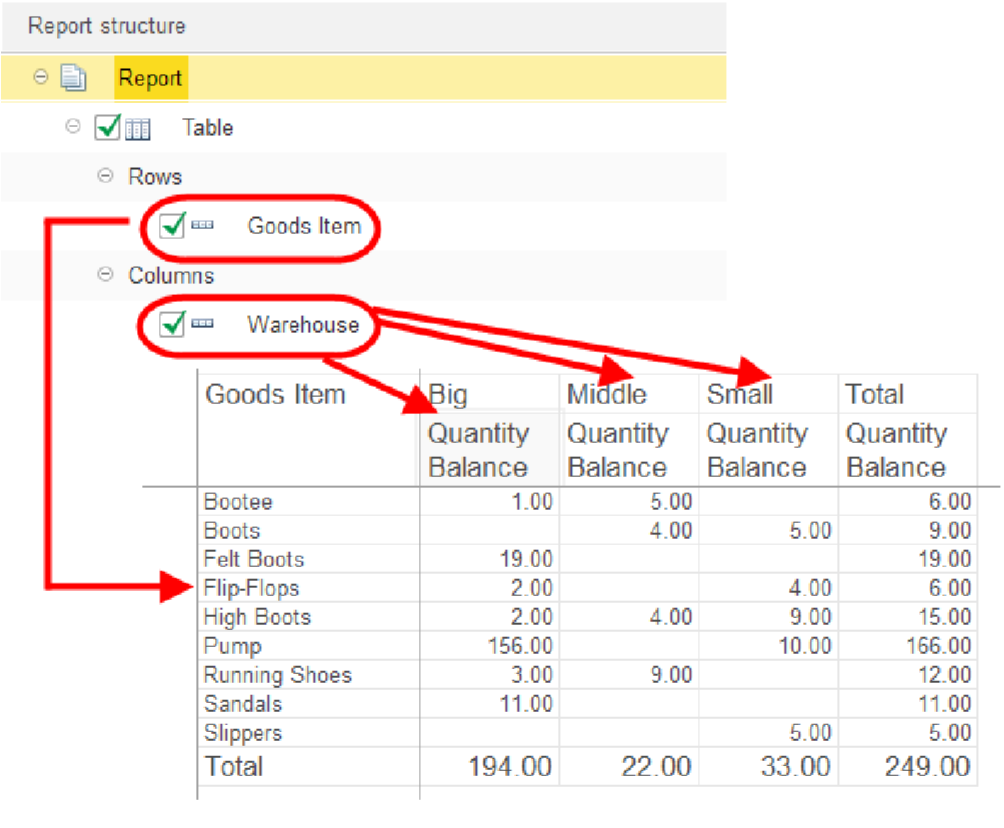
Fig. 113. Table in a report structure
Chart – displays the data as a chart. To add a chart into the structure, select Add – New chart. You can use points and series depending on the type of chart. One or several resources may be specified as values (of the selected fields) according to the application settings (see fig. 114).
Nested report – if a nested report was created for the report at the configuration stage, it can also be used as an element in the report structure.
TIP
The commands that are most frequently used for operations on the report structure can also be opened from the context menu of the Report structure field.
To remove an item from a structure, select it in the structure field and click Delete current item or press Delete.
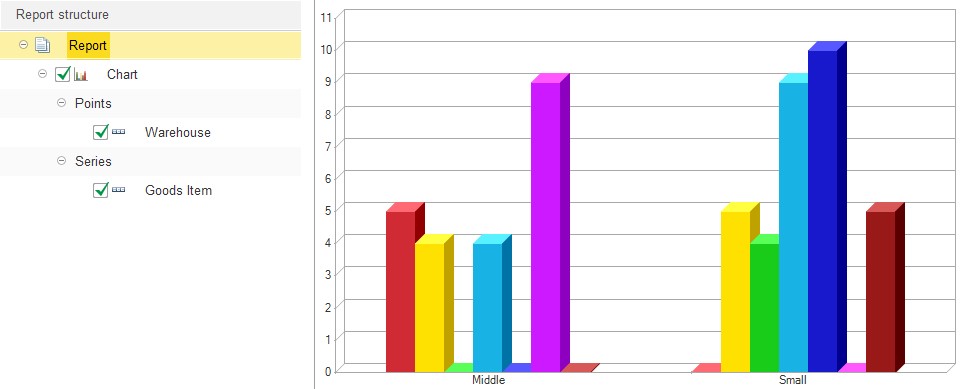
Fig. 114. Chart in a report structure
6.2.1. Customization of Report Structure Item
To customize a specific item of the report structure, select this item in the structure and on the setup tab check Current item has its own additional settings <setting name> (for detailed item customization).
Note that customization scope depends on the type of the item:
The following can be customized for a Grouping item: Grouped Fields, Fields, Filter, Sorting, Conditional appearance, Additional settings;
The following can be customized for a Table and a Chart: Fields, Conditional appearance, Additional settings.
NOTE
If a nested report is available in the report settings, note that settings for the reports are separated.
6.2.2. Setting Elements
6.2.2.1. Available fields
The list of available fields (see fig. 115) allows to easily select available fields and move it to the lists of fields to group by, to select, to filter by, to sort by using standard drag and drop operations. Using More menu for the available fields, you can select the current field or all the available fields to locate them to the corresponding collection (Select all will select all the fields that are on the same level with the current row in the tree of available fields; folders are not selected). The list of available fields includes: fields, resource fields and folders of fields.
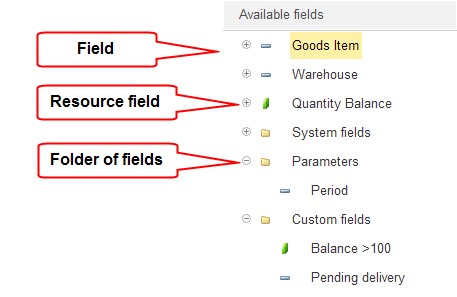
Fig. 115. The list of available report fields
The following nested fields may be used for each number resource in the report:
% in row or series: contains the ratio of the resource value in the current cell to the row total resource value in the table output. In the non-table output it shows 100%.
% in column or point: contains the ratio of the resource value in the current cell to the row total resource value in the table output. In the non-table output the field value is equal to the field Overall %.
% in row or series grouping: contains the ratio of the resource value in the current cell to the current group total resource value in the table output. In the non-table output it shows 100%.
% in column or point grouping: contains the ratio of the resource value in the current cell to the total resource value for the current group by column, which is equal to the field % in group in the table output. In the non-table output the field value is equal to the field % in group.
% in row or series group: contains the ratio between the resource value in the current cell to the total resource value at the current hierarchy level in the current group by row in the table output. In the non-table output it shows 100%.
% in column or point hierarchy group: contains the ratio between the resource value in the current cell to the total resource value at the current hierarchy level in the current group by column, which is equal to the field % in hierarchy group in the table output. In the non-table output the field value is equal to the field % in hierarchy group.
When these fields are displayed in a chart, the final field headers contain no references to rows or columns. For example, the field % in row or series in the output chart will have a % in series title.
When these fields are displayed in a non-chart object, the final field headers will not contain any references to series or points. For example, the field % in row or series in the output table will have a % in series title.
6.2.2.2. Parameters
If a report has some customizable parameters, they will be displayed in the list of available fields in the Parameters folder and will be available to include them into a report and to exclude them as well as to select a value (if multiple values were assigned to a parameter) on the Parameters tab. For example if a period is used for a report to be generated, the value for the report should be selected by the user.
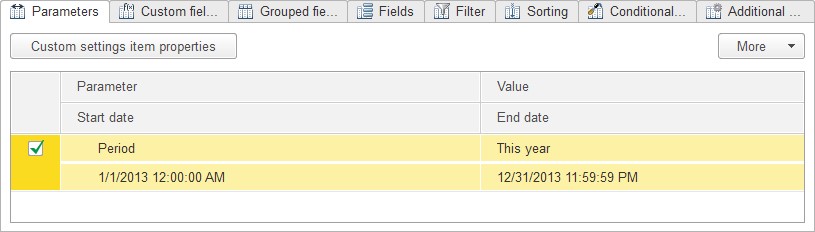
Fig. 116. Report parameters in the variant setup form
Parameters can be used as fields in various report settings. When a the report is run, parameter values are substituted to the settings for the fields that use them.
For example, if a report includes Company as a parameter, the field Parameters. Company will be available in the filter. When this field is selected as a value for a filter, Company will be used as a value for the parameter.
For a Date parameter you can both use a specific date and one of the standard dates as its value: beginning of this day, beginning of next day, etc.
6.2.2.3. Custom Fields
The Custom fields tab allows you to create fields to be used in a report. To insert a custom field into a report, add it to the list of selected fields. At that ability to use a custom field in a report item is defined automatically.
There are two types of custom fields: selection field or expression field.
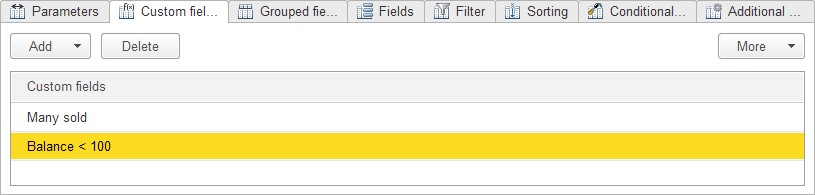
Fig. 117. Custom fields in report variant settings
A selection field may have multiple values. The first value to satisfy the filter condition will be selected to record to a report. Specify a title and expression for the filter, value and short filter presentation if required.
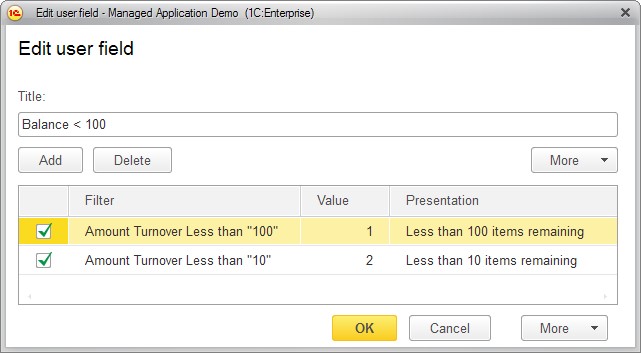
Fig. 118. Report setup. Custom selection field
Filter conditions are defined in a new window and are added using the Add button. Next select a field from the list of available fields, Comparison type and define a Value for comparison.
To define an order of the filter items, use the arrows on the command bar or drag an item to the required row with your mouse.
A custom expression field will be displayed in a report as a resulting value of expressions. Expressions are composed using Available fields of a report and the expressions of the data composition system language. Custom fields may be used in any location within a report. Custom resource fields cannot be used as a field to group by.
In the Edit user field dialog select a title and expressions for detailed and resulting records (see fig. 119).
The names of the fields containing spaces and/or special characters, should be enclosed in square brackets [].
Expression for total records should be written using statistical functions, e.g.: Amount (Field) * 2.
For details on data composition language, see book "1C:Enterprise 8.3.User manual", Appendix 1. Data Composition System Expressions Language available in the electronic version of the documentation.
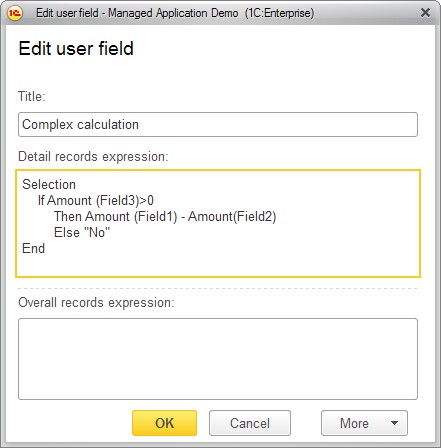
Fig. 119. Custom expression field
6.2.2.4. Grouped Fields
On the Grouped fields tab, you can select fields to group by and the type of grouping.
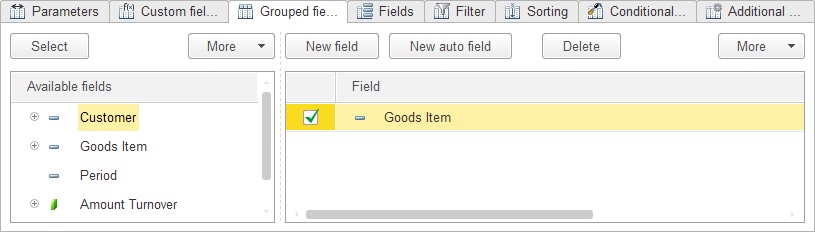
Fig. 120. Grouped fields in the report item
A grouping may have one of the following types:
Elements – the group will only include non-hierarchical records (items).
Hierarchy – the group will include both hierarchical and non-hierarchical records (items and folders).
Hierarchy only – the group will only display hierarchical records (folders).
The menu allows to add a new field or a new auto field.
Auto field of grouping
A grouped auto field is a set of fields that are generated automatically following the rule below. The fields used in the report are selected provided that they are:
Available to use in the fields to group by Are not resources
Are not attributes of other selected fields
Are not attributes of existing fields to group by
To view the set of fields that the auto field of grouping will be transformed into when the report is run, select More – Expand.
If a field is already included in the data of the grouping field, it will not be added repeatedly.
If available types of the grouping field include date, it is possible to customize period addition (to include the dates that do not fall into the result into the report). For example, if you want the data for all the weeks to be included into a report, select Week as an addition type and choose the start and end dates of the period as shown below.
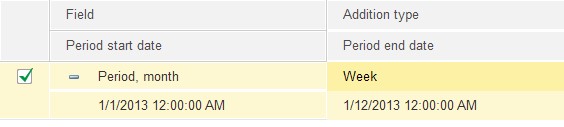
Fig. 121. Customization of group by addition
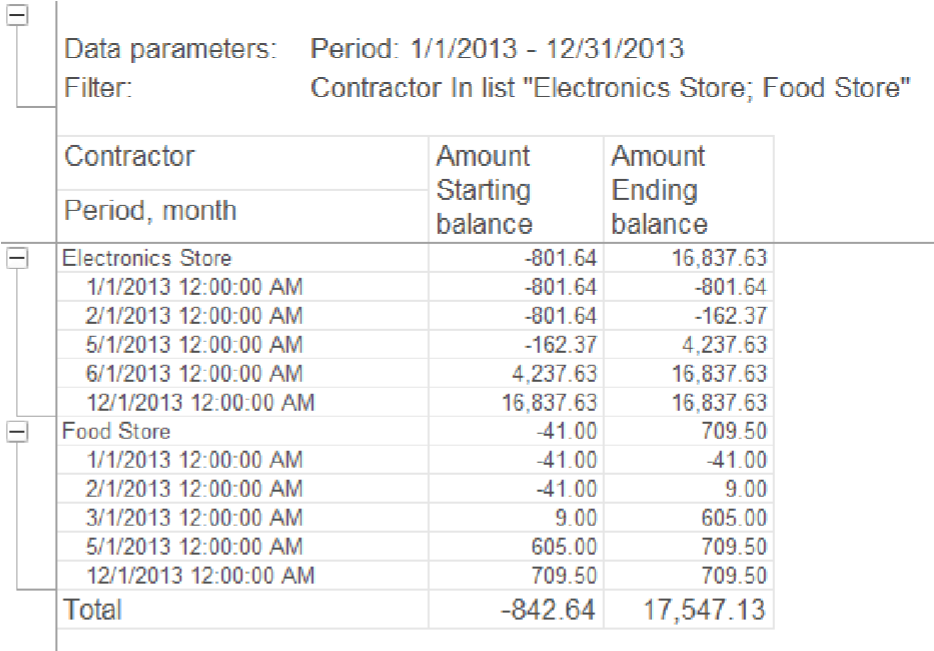 Let us illustrate this with an example. Suppose the Mutual Settlements report includes the data on mutual settlements
with stores named "Electronics Store" and "Food store" for
the period from the 1st of January, 2013 to the 31st of December, 2013.
Let us illustrate this with an example. Suppose the Mutual Settlements report includes the data on mutual settlements
with stores named "Electronics Store" and "Food store" for
the period from the 1st of January, 2013 to the 31st of December, 2013.
Fig. 122. Report without addition
At that you now need to display data by the quarters. To do so, we will need to specify an Addition type for the Period, month on the Grouped fields tab.
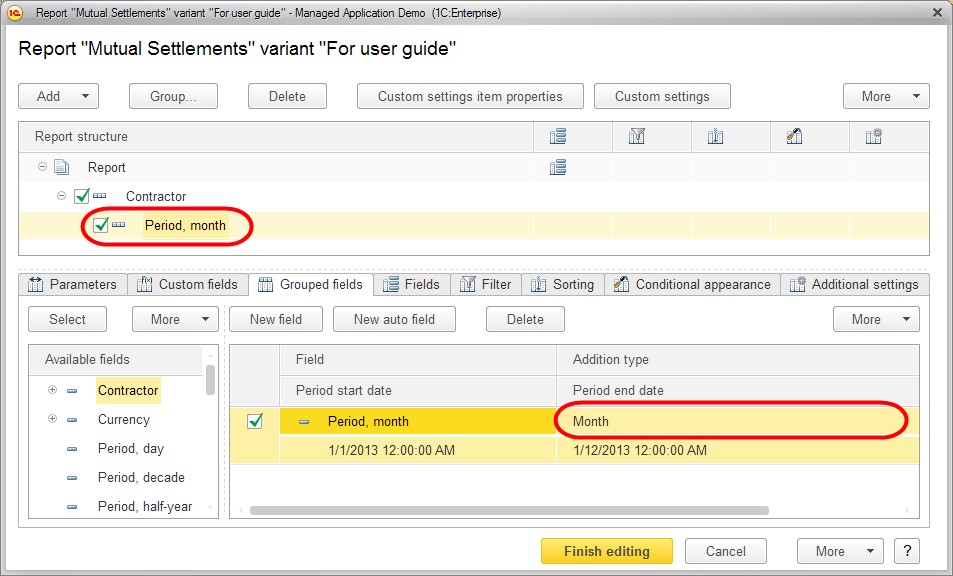
Fig. 123. Setup of report addition
This will result in the Mutual Settlements report changing as follows:
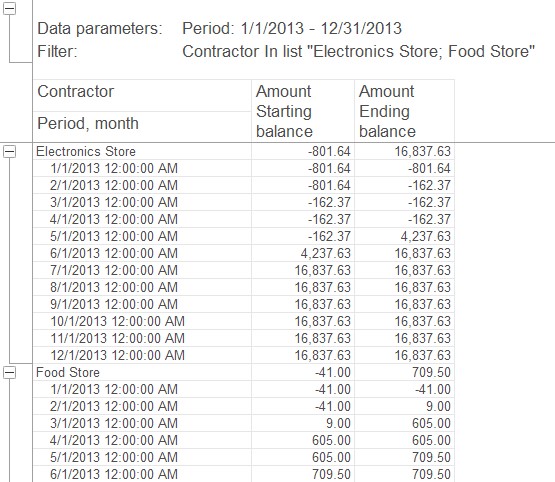
Fig. 124. Report with an Addition
6.2.2.5. Fields
The Fields tab is intended to select the fields to be displayed in the report. If no fields are selected, an empty item is included into the report. Using menu or context menu, you can add a new field, a field group or an auto field. A field group can be named and you can also manage their location in the current report item.
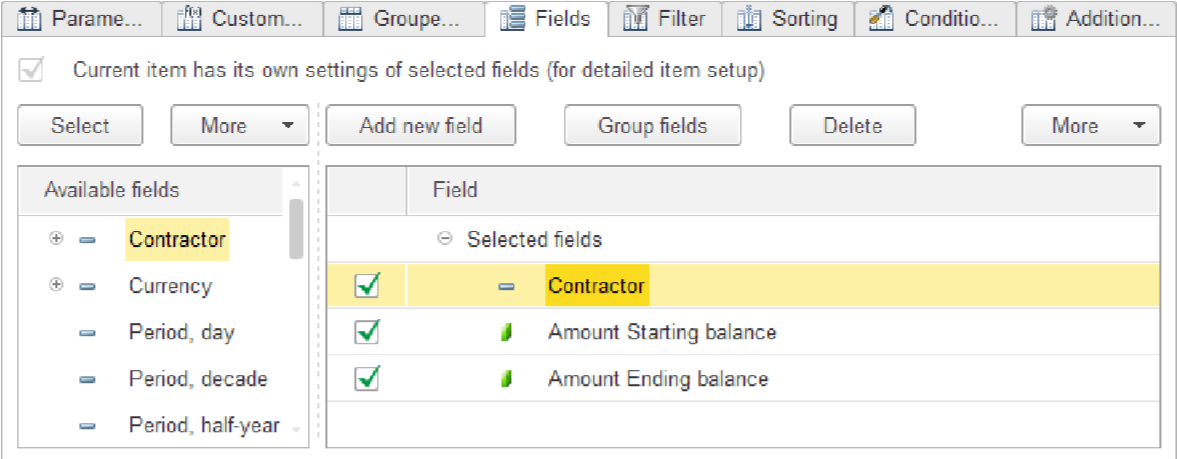
Fig. 125. Report setup. Fields
6.2.2.6. Selection Autofield
You can use automatic field sets as fields during system customization. When creating report structure elements, the system automatically adds an <Auto> field as a selection field. Selection autofield is a set of fields to be converted to when creating a report. To view a set of fields, use the More – Expand command. If you need to add an autofield, use the More – Add new auto field command.
When a selection autofield is expanded, it is transformed into a set of selected fields.
The assortment of the set of fields depends on the structure item the expanded auto field belongs to and the part of structure this item is located in. For every item, the system passes through all the parent items of the report structure and selects the resources and fields from the selected fields of these items following these rules:
For a grouping and a table grouping an auto field is replaced with all the used fields of the grouping that are available for use in the selected fields; the fields that are attributes of its grouping fields and resources of parent items.
WARNING!
In the process the system only takes into account the groupings of the types Elements or Hierarchy.
For a chart grouping the resources are not selected. Instead, all the parent items of the settings structure are passed and the grouping fields are selected among the selected fields of these items if Hierarchy only grouping has been defined for this grouping.
For groupings of the type Detailed records (grouping, table grouping, chart grouping) all the used fields are selected from the main selected fields of settings the grouping belongs to except for the fields that participated in the above grouping and attributes of these fields. It the grouping is of the Hierarchy only type, its fields and attributes will be used by the system when a set of selection fields is generated. Resources are not selected for a chart grouping either.
In a chart, a selection autofield is replaced with all the resources specified for the chart. Depending on the application settings, the selection autofield may be replaced with the resource that occurred first during the abovementioned iteration.
For a table a selection auto field is converted to a set of resources used by the parent items.
NOTE
If a field is already included in the data of the selected field, it will not be added repeatedly.
At that the fields are added into a set as follows: first the fields of the grouping’s own fields (for groupings), next fields of the global settings (for Detailed records groupings) while the last to be added are the resources and fields of the parent items.
The selected fields can be joined into groups that are added using Group command (for the command to be available, all the highlighted rows of the table should share the parent). Ungroup command is used to delete the fields while nested fields are preserved. For a group you can define a location within the current item of the report structure. To do so, select the required location type from the list in the Location column.
6.2.2.7. Filter
On the Filter tab, you can select the fields to filter records of the report result. Using the menu, the context menu or by double-clicking any of the selected fields among the available fields you can add an item or a folder of items. Here you can select a filter from those predefined by the developer or add another filter.
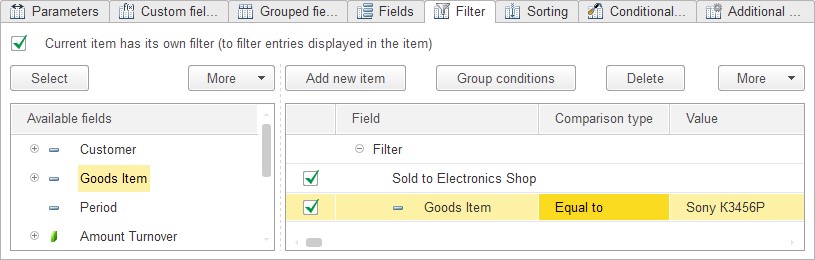
Fig. 126. Report item setup. Filter presentation
When you use More – Detailed, this tab will display the filter conditions along with their presentations.
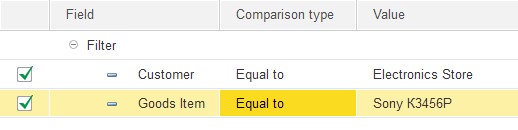
Fig. 127. Report item setup. Filter
In this tab's columns, you can specify values for the records of the report result to be filtered by.
Presentation. Using Set presentation command of the context menu, you can define a presentation for the created item or folder of a filter. This presentation will display the information on the filter item in a list if the Detailed button on the command bar is not clicked. If no presentation was defined for a filter, its detailed presentation will be the same as non-detailed presentation on the Filter tab.
Application. For a grouping, grouping in a table and grouping in a chart, there is another available property for the filter items – Application.
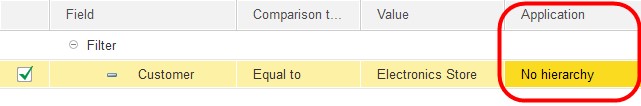
Fig. 128. Application setup for a filter item
If Application has the value Hierarchy, the filter condition is checked after hierarchy is composed. Hierarchy only as a value demonstrates that the filter condition is only checked for the hierarchical records. Filtered records still influence the resulting values of the resources of the superior hierarchical records. The nested groups of records that are filtered by these properties, will also be included into the report. Comparison types
This section describes the types of comparison that are available for filters.
Equal to – the result will include the records with the value of the field defined as the left value equal to the right value.
Not Equal – the result will include the records with the value of the field defined as the left value not equal to the right value.
Less than – the result will include the records with the value of the field defined as the left value less than the right value.
Less than or equal to – the result will include the records with the value of the field defined as the left value less or equal to the right value.
Greater than – the result will include the records with the value of the field defined as the left value higher than the right value.
Greater than or equal to – the result will include the records with the value of the field defined as the left value higher or equal to the right value.
In list – the result will include the records containing the fields having the value available in a list. The list of values is defined in a new window that is opened when you select the Value column.
In list group – the result will include the records with their values belonging to a folder available in the list. The list of groups is defined in a new window that is opened upon selection.
In group – the resulting document will include the records with their left value field being in the specified folder of the list items.
In a group from the list – all entries whose values refer to the groups in the list or which are specified in the list will be output. A list of groups and elements is created in a separate window that opens during selection.
Not in list – the result will include the records that do not contain the fields having the value available in a list. The list of values is defined in a new window that is opened when you select the Left Value column.
Not in list group – the resulting document will include the records with their left value field being in the specified folder of the list items.
Contains – the result will include the records that contain the substring that is used as the value.
Does not contain – the result will include the records that do not contain the substring that is used as the value.
Filled – the result will include the records that have the specified field populated.
Not filled – the result will include the records that have the specified field unpopulated.
Joining Filter Conditions
The filter conditions may be combined into logical groups using AND, NOT or into groups using OR. To combine conditions, select them and click Group conditions:
If the conditions are joined with AND, the report will include the data that satisfy all the conditions in the group.
If the conditions are combined with NOT, the resulting document will not include the records that meet all the conditions of the group.
If the filters are joined with OR, the data will be recorded if at least one of the conditions is satisfied. Using context menu you can define presentations for groups. If a group has a presentation, the nested folders will not be displayed in the short mode.
6.2.2.8. Sorting
On the Sorting tab, you can select the fields to sort report results by. You can add an order element or an auto order element. When a report is executed, the system transforms (expands) an order auto item into the fields it will sort by.
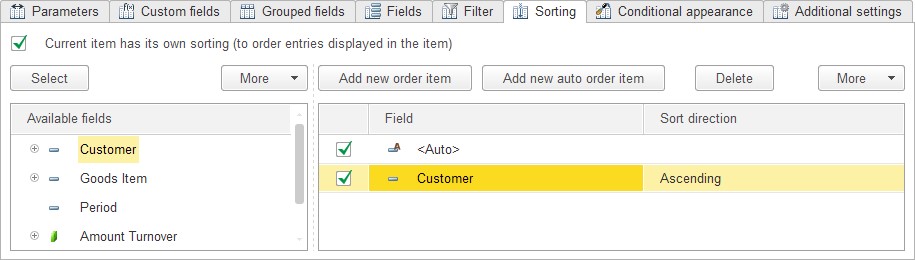
Fig. 129. Fields to sort by for a report item
For an order auto item the More menu includes Expand command that is intended to view the set of fields that this field will be transformed into when the report is executed. When an auto item (of order) is expanded, resource fields will be unconditionally added from the global order while those fields that are not resource fields will be added to the order that are the attributes of the grouping field and the grouping field will be added itself (all the fields will be added for the detailed records). The grouping fields that were not specified in the global order, will be located in the end of the order.
6.2.2.9. Conditional Appearance
The Conditional appearance tab is intended to define formatting for various report items depending on the values of the data recorded into the report. For example, it is possible to apply a specific color to negative values, etc. Multiple structure items can be formatted in this manner. At that areas to be formatted are defined for every item.
Conditional appearance can include multiple items. Every item describes an area to be formatted.
An area is a list of fields that are selected from the list of available fields. If no area is specified, conditional appearance will be applied to the entire report item.
For every area you can specify conditions that will cause the selected formatting to be applied to the area.
The conditions to select fields are specified in a new window that is similar to the filter window of the custom selection field. For details on filters, see page 107.
If two different appearances apply to an area, the one that is the last in the list of conditional appearance elements is applied.
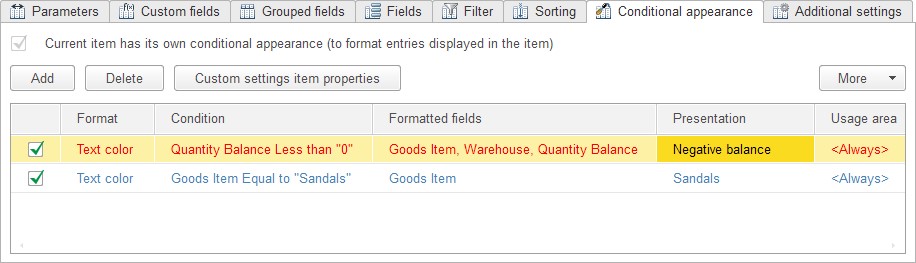
Fig. 130. Conditional appearance items in the detailed mode
The Format column defines a designation for the conditional appearance of an area that will be used to display this appearance in the list of conditional appearances provided that the button near the Detailed command of the More menu is not clicked.
The conditional appearance parameters are specified in a new window. You can select the color of the background, text, cell borders, the text font in the cell, etc.
Background color – specifies the color of the background.
Text color – defines the text color for text data.
Color in chart – defines the color of data series in a chart.
Border color – the color to be applied to the border of a data item.
Border style – the color to be applied to the border of items. It is possible to define the type for every border independently.
Font – the font for the text data to be displayed.
Indents – defines an indent for a specific number of characters.
Autoindent – if this option is set to more than 0, indentation will be defined as a product of the grouping level and property value when groupings are displayed.
Horizontal position – this property selects horizontal alignment of text.
Vertical position – this property selects vertical alignment of text.
Placement – specifies how text should be displayed if it does not fit into a cell.
Text orientation – a number that defines text tilt angle in cells of groupings and tables.
Format – defines data display format.
Mark negatives – if this property is set to Yes, any negative values will be highlighted in color in the report output.
Unfilled mark – if this property is set to Yes, any incomplete values will display differently in the report output.
Minimum width – a number that defines the minimum number of characters for the width of data display.
Maximum width – a number that defines the maximum number of characters for the width of data display.
Minimum height – a number that defines the minimum number of characters for the height of data display.
Maximum height – a number that defines the maximum number of characters for the height of data display.
Text – arbitrary text describing the data.
To define the area of application for the appearance item, double-click the Usage area column, which opens the Advanced tab in the conditional appearance editor dialogue box. If the box next to the area is checked, then the appearance item will be used when this area is displayed.
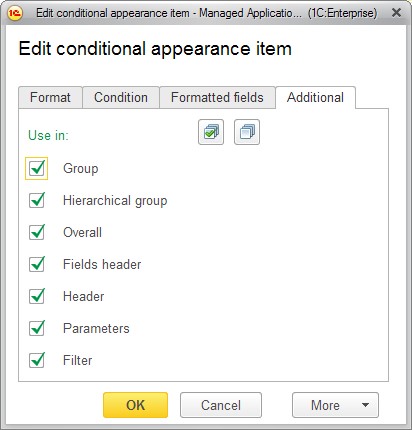
Fig. 131. Setting the appearance item area of application
All the boxes are checked by default. To perform a quick edit, you can use the Select All and Unselect All buttons.
NOTE
The conditional editing item area of the application cannot be set when you are customizing the dynamic list.
6.2.2.10. Additional Settings
The Additional settings tab defines display parameters for a selected structure item. For example, for a grouping the tab’s content will be as follows:

Fig. 132. Additional settings of a report item
NOTE 1
When generating a report, the system displays an error message if a nested report has a top-level field for which it is impossible to define a value.
NOTE 2
When you place a Pie type chart in report structure, note that if the points are set and the series are not, the system automatically uses points as series. For Line chart type, if the series are set and the points are not, series are used as points.
6.3. SELECTING SETTINGS ITEMS
To specify that a setup item should be available in the report setup form, use Custom Settings Item Properties command in the item setup.
In the custom item setup form you can demonstrate that this is a custom element and also specify a presentation to be used for the item and editing mode (normal, quick access, unavailable), see fig. 133.
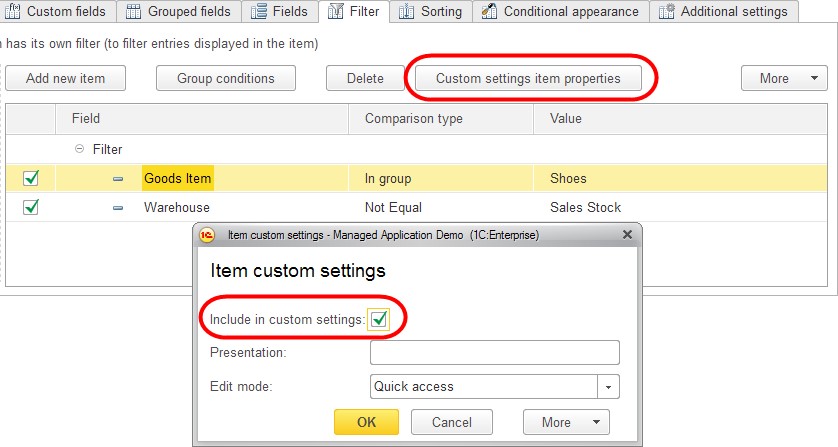
Fig. 133. Adding a custom settings item
In the settings structure list, the Custom settings item properties command allows to customize custom settings for the current structure item.
Every structure item has its own assortment of customizable items.
|
Object |
Customizable Items |
|
Report |
Selected fields, order, filter, conditional appearance, assortment of groupings |
|
Grouping/table grouping/chart grouping |
Grouping, selected fields, filter, order, conditional appearance, assortment of nested groupings |
|
Chart |
Chart, selected fields, conditional appearance, assortment of series groupings, assortment of points groupings |
|
Table |
Table, selected fields, conditional appearance, assortment of rows groupings, assortment of columns groupings |
|
Nested schema |
Nested report, selected fields, filter, order, conditional appearance, assortment of groupings |
Depending on where you use Custom settings item properties, the command allows you to change various settings:
Filter list – the settings for the current item/folders of the filter;
List of output parameters and data parameters – settings for the current parameter;
Conditional appearance list – settings for the current item of conditional appearance.
NOTE
If the setting is included under custom settings then, when the report is run, its value will be received from custom settings and not from the report version.
When the report variant is being edited, modification of setting previously saved in custom settings does not affect the report result, because the setting value is obtained from the previously saved custom setting.
Besides, the Preview custom settings command available on the report structure command bar (see the figure below), makes it possible to open a modal form that will display the settings along with their default values.
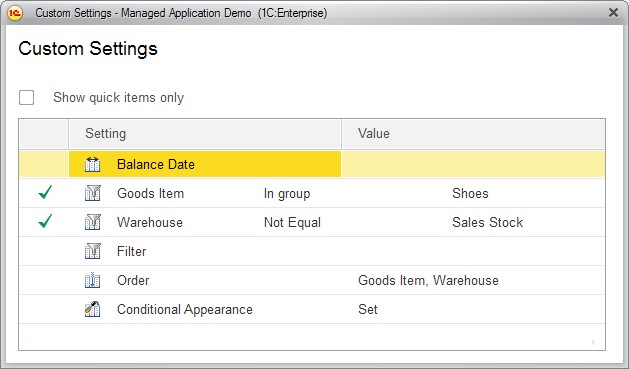
Fig. 134. Custom settings preview