
1C:Enterprise 8.3. User Manual. Taxi Interface. Contents
CHAPTER 5. REPORTS
Reports are used to obtain data from the 1C:Enterprise infobase.
In the 1C:Enterprise mode a user may generate a report with the suggested settings or customize the settings. Experienced users may also develop their own report variants.
The default appearance of a report form is shown below:
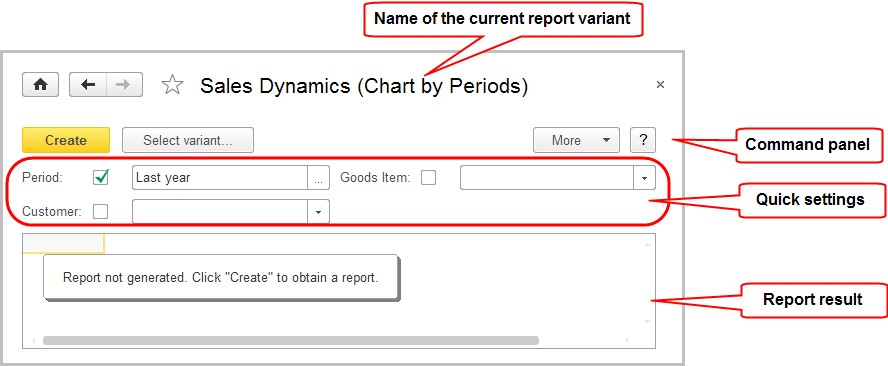
Fig. 81. Report form
To generate a report with the predefined settings, it is sufficient to click Create button on the report command bar.
If multiple variants are provided for a report, you will have to select the required variant before this operation. This is done using Select variant button in the report form. For details on working with variants, see "Report Variants" on the page 80.
In order to customize a report settings, you can use either the quick settings field or a dedicated dialog opened with the More – Settings command. For details on the settings, see "Using Quick Settings" and "Settings" below.
Once a report’s result is generated by the system and exported to a spreadsheet document, you can use the details mechanism. For details see "Working with Report Details" on the page 90.
Depending on the report settings, a report form may include the following commands in the More submenu:
Settings – opens a form of settings.
Select settings – opens the form to select a previously saved setting.
Save settings – saves the changed report settings.
Set standard settings – loads the settings from the report variant.
Change variant – opens the window to customize the report variant.
Select variant – opens the form to select a report variant.
Save variant – opens the form to save the report variant.
Change form – opens the form used to customize the report form.
Open a new window – opens a new report form with current settings.
For details on working with settings, see "Using Quick Settings" section and "Changing Report Variant" below.
The procedure used to work with report details is described in "Working with Report Details" on the page 90.
NOTE
Forms with hidden system commands are shown in fig. 81 and the other illustrations in the examples below.
5.1. REPORT SETUP
Some report settings may be edited in a dedicated form. When a report is processed, these settings are used together with the main report settings.
To open a form where you will be able to edit settings, click Settings in the report form.
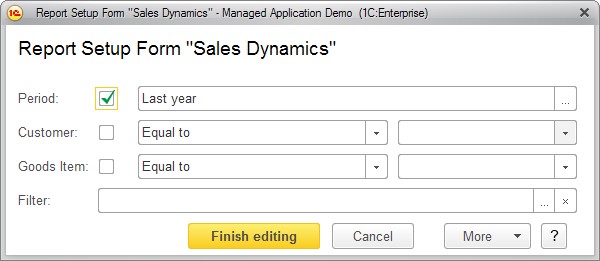
Fig. 82. Setup form for "Sales Dynamics" report
To save the selected settings, click Finish editing.
To edit the settings displayed in the report form, select More – Change settings assortment The settings list editing form then opens in a new window.
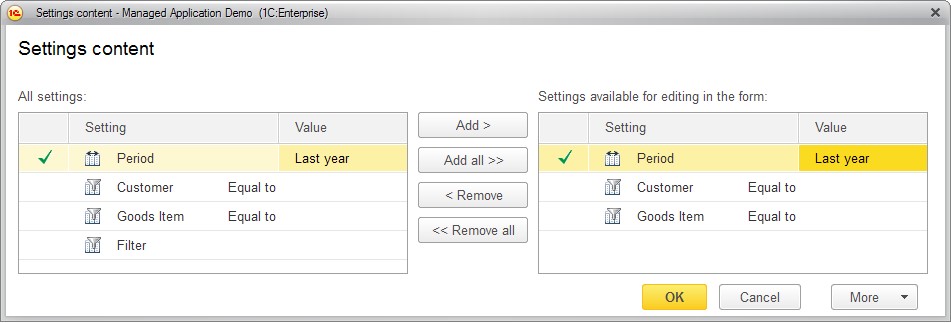
Fig. 83. Changing the report settings set
All available report settings are displayed on the left, and the settings edited in the report form are shown on the right.
To manage a set of user settings, use the following buttons:
Add > – adds a setting from the list on the left to the right.
Add all >> – adds all settings from the list on the left to the right.
< Remove – deletes the setting from the list on the right.
<< Remove all – deletes all settings from the list on the right.
Standard user settings can be restored by clicking More – Set default settings. If the settings do not result in generation of the required report, you can create your own report variant. You need to have some experience with reports to be able to create a report variant. For details on working with report variants, see "Editing a Report Variant" on the page 95.
When a report form is closed or current report variant is changed, custom settings are saved automatically. Custom settings are saved independently for every report variant.
It is possible to select some settings that will be edited most frequently (for example, filter by goods in the Sales Dynamics report or filter by company in the accounting report). These settings will be edited directly in the report form.
If you set filter in the report settings form, a filter element will be added to the settings list and the settings displayed in the report form.
To use a selected setting in a report, define the value for the setting in the respective field.
Based on the type of the setting, you should use one of the following actions:
Select a value from the list that pops up when you click Select in the setting field,
Specify a value in the new window that is displayed when you click Select in the setting field.
A sample of a report setting in a new window is shown below:
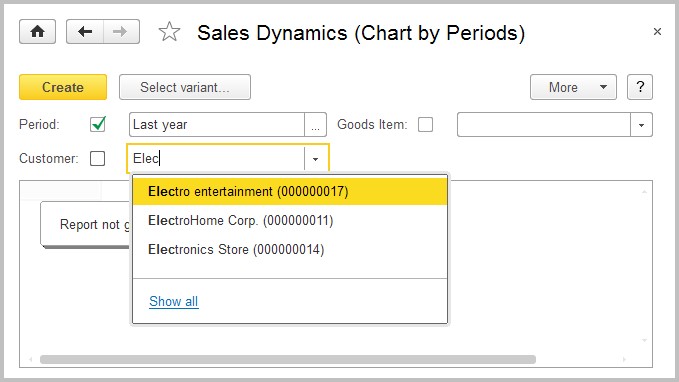
Fig. 84. Selecting a value of quick report setting
A report is not generated when settings are edited.
To generate a report with the defined settings, click Create.
To disable use of the selected setting in a report, uncheck it in the respective row.
5.2. REPORT VARIANTS
Multiple variants may be created for a report. A variant defines the view for the data to be displayed as a result of the report. For example, for a Sales Dynamics report you can create a variant where the data on sales of goods by periods are displayed as a chart and another variant where data on sales by customers are displayed as a table. At that each report variant has its own set of settings.
The system enables you to create a new report variant directly in the 1C:Enterprise mode. Before you do this, carefully study "Editing a Report Variant". If this action is initiated, a new report variant is saved in the infobase.
It is possible to define multiple versions of settings for every report.
For details on working with versions of settings, see "Editing a Report Variant" on the page 95.
5.3. WORKING WITH REPORTS
Let us consider in details user’s work with a report using Sales Dynamics report of the demo configuration as an example. Let us initiate the report using the respective command on the action panel. The report form will be opened in a new window.
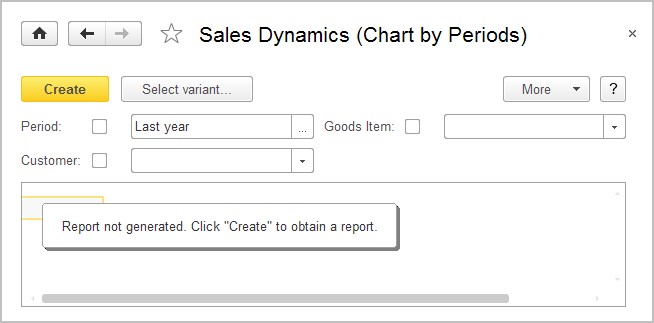
Fig. 85. "Sales Dynamics" report form
When the report is initiated, Chart by Periods is selected as a variant for the report. Suppose we need another variant.
Now let us click Select variant and select Sales of Goods by Customers report variant in the new window.
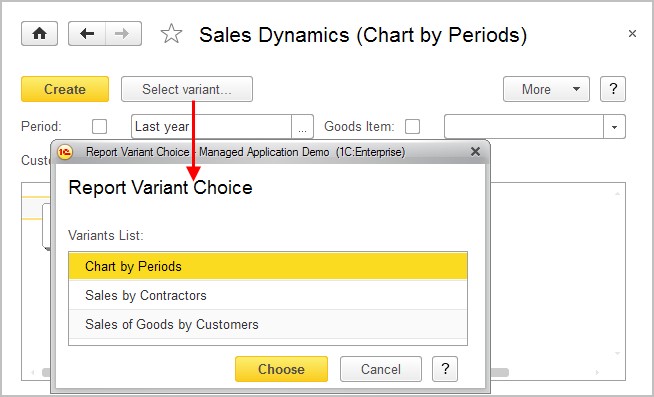
Fig. 86. Selecting a report variant for the "Sales Dynamics" report
Note that the following settings have been selected for this report variant: Period – This year and grouping by the fields Goods Item and Customer.
Suppose these are the settings we currently need and generate the report by clicking Create.
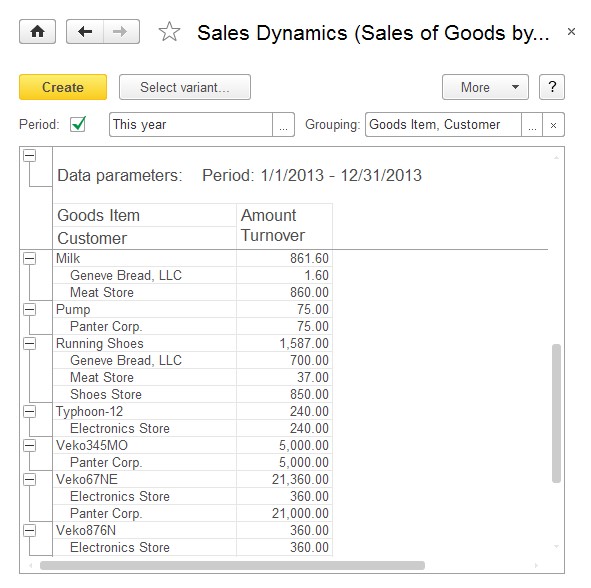
Fig. 87. "Sales Dynamics" report in the variant "Sales of goods by customers"
NOTE
A table header is fixed automatically to simplify working in the reports with a single table or group. In addition, fixation is not used if the spreadsheet fixation area exceeds the screen area.
5.3.1. Using Quick Settings
Suppose we want to obtain a report on sales over the custom period: from 1/1/2012 to 12/31/2012. To do so, we need to change the Period parameter and click Create:
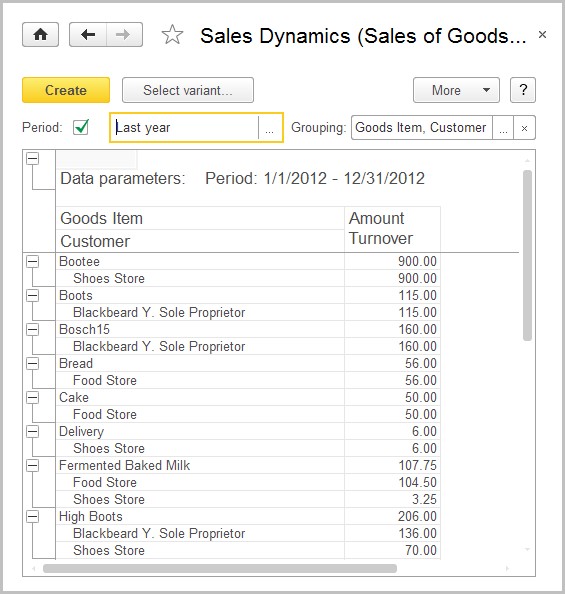
Fig. 88. "Sales Dynamics" report for the previous year
5.3.2. Settings
Suppose it is not sufficient to change the visible parameters (Period and Grouping). To view the parameters that can be customized for the report variant, click Settings. A list of settings will open in a new window.
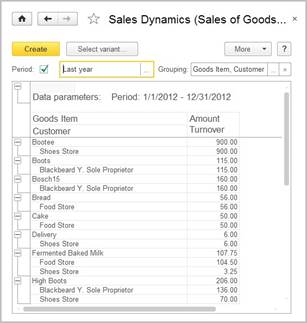
Fig. 89. Setup form for "Sales Dynamics" report
5.3.2.1. Filter
To apply a filter, define a value for the filter in the settings form. To do so, select the Value column in the item row and click Select or press F4.
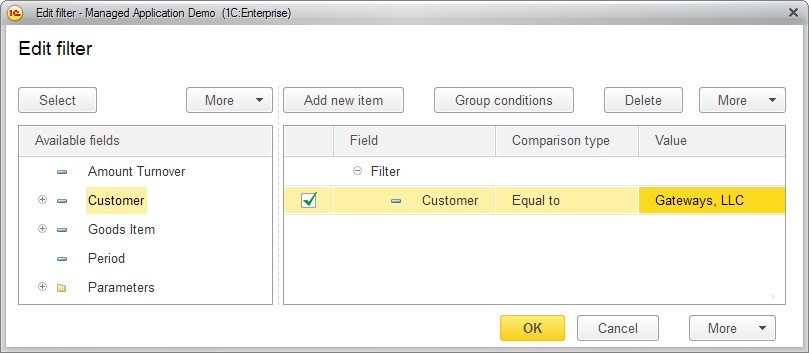
Fig. 90. Filter setup form for "Sales Dynamics" report
1. In the window that opens click Add new item or drag a field from the list of Available fields.
2. Select Comparison type from the list that pops up when you click Select.
3. Define a filter value by selecting it from the list that opens when you click Select or enter it to the column.
4. If required, define the order for the filter items with Move the current item up and Move the current item down buttons.
5. Click ÎK.
For details on using filters and the comparison types, see "Filter" section on the page 60.
5.3.2.2. Sorting
To define an order of records in the report results, in the Sorting field click Select or press F4.
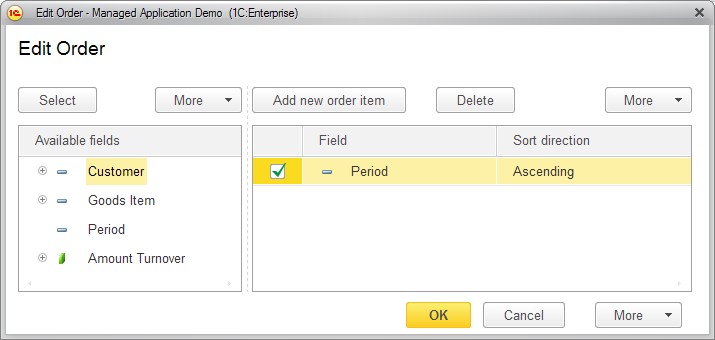
Fig. 91. Sorting setup for "Sales Dynamics" report results
1. In the window that opens click Add new order item and select the field or drag a field from the list of Available fields.
2. Select Sort direction (Ascending/Descending).
3. If required, define the order for the sorting items with Move the current item up and Move the current item down buttons.
4. Click ÎK.
If multiple sorting fields exist, the data in a report will be sorted initially by the first field followed by the second field, etc.
For details on working with sorting, see page 110.
Sample Sorting Setup
For example, let us sort the Payments Report by supplier and by document dates for every supplier. The filter settings will look as follows:
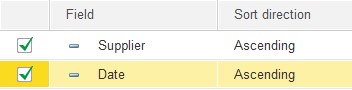
Fig. 92. Setup of report sorting
In the editing form click OK. The resulting report will look as shown below:
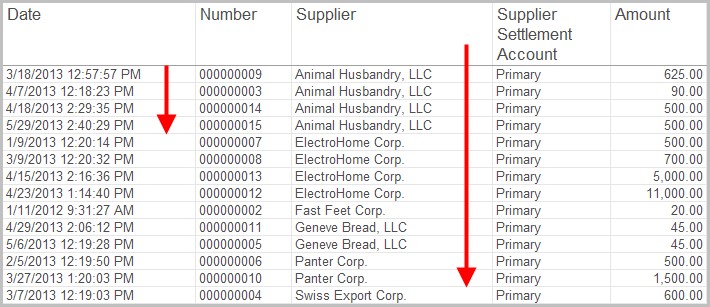
Fig. 93. Result of report sorting setup
5.3.2.3. Conditional Appearance
To define a conditional appearance for report result records, in the settings form, in the Conditional Appearance field click selection button or press F4 (see fig. 94).
1. In the window that opens click Add.
2. Select the required appearance parameters on the Format tab: background color, font color, etc.
3. Specify the condition for formatting to be applied to the fields on the Condition tab. A condition is specified in the same manner as it is for filter.
4. On the Formatted fields tab from the list of available fields select those fields for appearance to be applied to if the condition is satisfied.
5. If required, define the order for the used appearance elements with
Move the current item up and Move the current item down buttons. The order of appearance elements defines the sequence for appearance to be applied to report elements. If two different appearances apply to a report area, the one that is the last in the list of conditional appearance elements is applied.
6. Click ÎK.
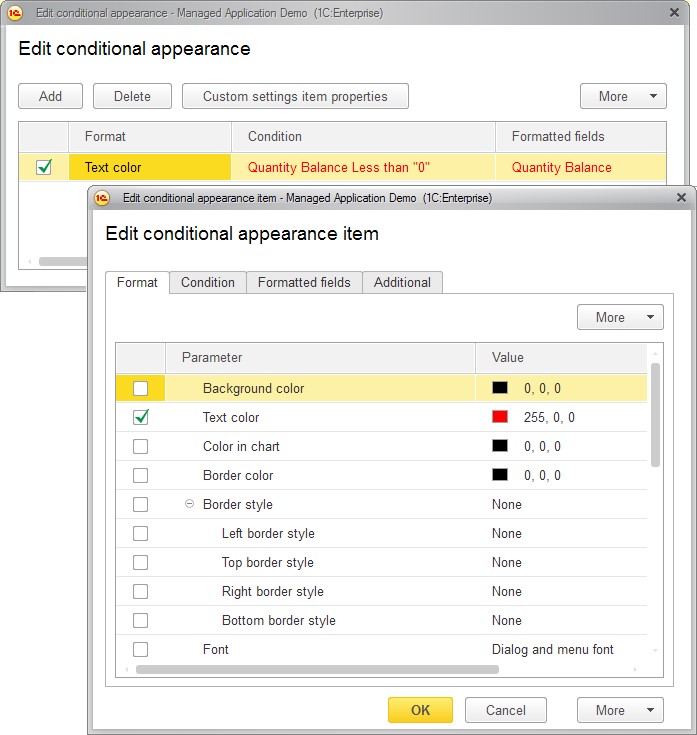
Fig. 94. Conditional appearance of a report setup
For details on conditional appearance customization, see page 110. Sample Conditional Appearance Setup
For example, let us select the documents associated with Electronics Store from the Report on Mutual Settlements.
To do so, in the report settings we will proceed as follows:
1. Add a new item on the Edit conditional appearance window.
2. In the dialog for editing a conditional appearance item on the Format tab we will click Select and in the Select font dialog check Bold in the Font style group.
3. On the Condition tab we will add a new item as follows: Contractor Equal to "Electronics Store".
4. Click ÎK and make sure that all fields are displayed in the Formatted fields column.
The setting for a conditional appearance of a report will look as shown below:

Fig. 95. Sample conditional appearance setup
In the variant customization dialog click Finish editing. The report will change to the view shown below:
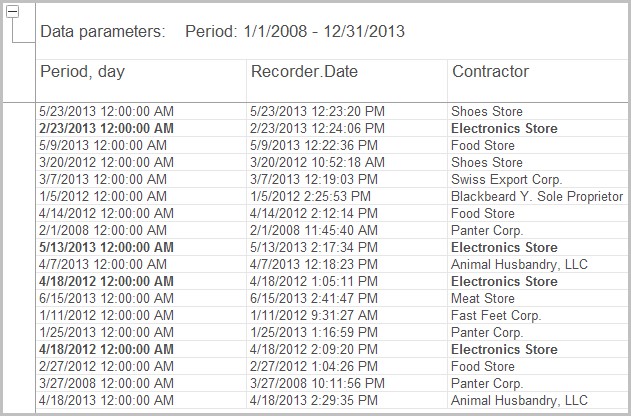
Fig. 96. Conditional appearance of a report setup
5.3.2.4. Grouping
To define a grouping of report results, in the setup form in the Grouping field click selection button or press F4 (see fig. 97).
1. Click Add.
2. In the window that opens select Grouped field and define the type for the grouping:
○ Elements – the group will only include non-hierarchical records (items);
○ Hierarchy – the group will include both hierarchical and non-hierarchical records (items and folders);
○ Hierarchy only – the group will only display hierarchical records (folders).
3. Click ÎK.
4. If required, define the order for the groupings with Move the current item up and Move the current item down buttons.
5. Click ÎK in the grouping editing window.
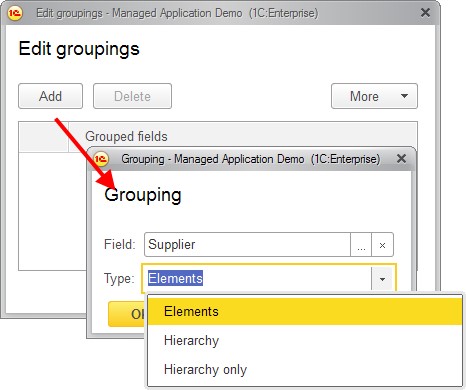
Fig. 97. Report grouping setup
For details on working with grouping, see page 103.
Sample Grouping Setup
For example, let us group the result of Report on Payments by the name of supplier. To do so, we will select Supplier field with Hierarchy type as the field to group by.
The result of report output is shown below:
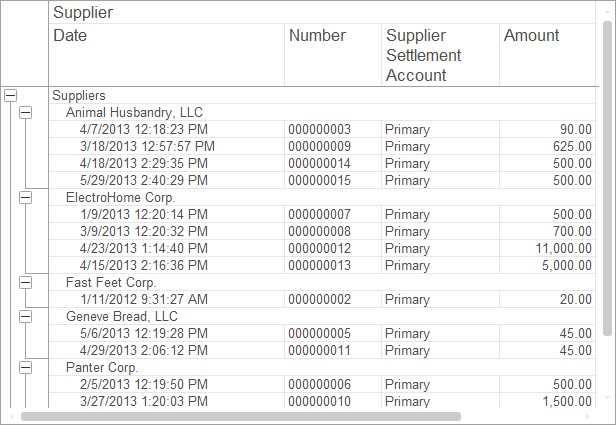
Fig. 98. Report on payments grouped by "Supplier" field
5.4. WORKING WITH REPORT DETAILS
When you mouse-over a cell of a report result, the cursor will change its shape if details are possible for the cell (see the figure). If you now double-click this cell, the details menu will be displayed.
Double-clicking this cell opens the cell’s value in a new window, while doubleclicking the cell with resources prompts you to select a field for entering the details, after which the details are created.
Right-clicking always displays a details menu (see fig. 99).
Drill down – view detailed information on the content of the field. All the details are displayed in a new window.
For example, let us find out when Sandals were sold. To do so, in the already generated Sales Dynamics we will select the cell Sandals and open Drill down.
In the field selection window that opens we should select Period (see fig. 100).
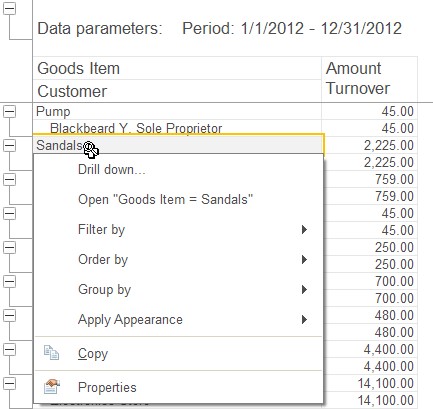
Fig. 99. Details menu for a report cell

Fig. 100. Selecting a field for report details
Click Select. The details will open in a new window.
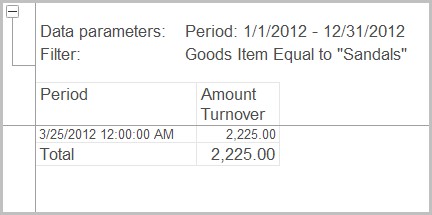
Fig. 101. Report details
The command Open "…" will open the viewing form for the data displayed in the cell. For example, a window containing a form of the list item.
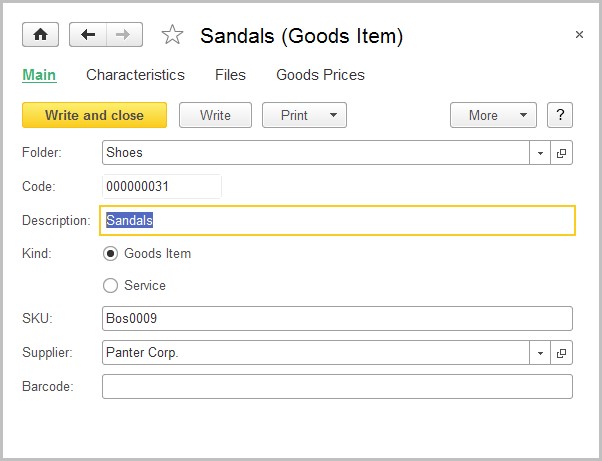
Fig. 102. Form of a list item
Filter by – enables filtering of the current report structure item by the value of the selected field or defining a filter by the value of another field (use Other field and specify a filter condition). For example, let us filter out the rows of the report with Amount (Turnover) over 50,000.
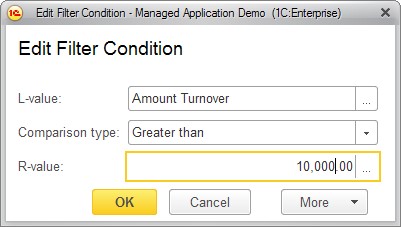
Fig. 103. Filter condition editing dialog
The result is displayed in a new window.
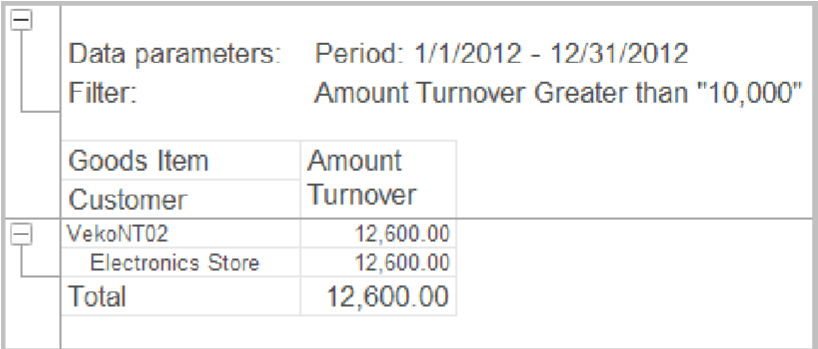
Fig. 104. Filter result
Order – applies ordering of the current report item content by the value of the current field. Clicking Advanced enables you to specify an arbitrary field. For example, the table of the report may be ordered by the Good field.
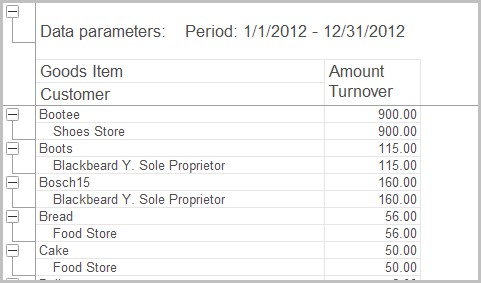
Fig. 105. Result of report ordering
Group by – selects a field and defines a type of grouping in the current item of the report structure. For example, from the Balance of Goods report we need to find out what shoes are available in which warehouse. To do so, let us select Warehouse grouping field.
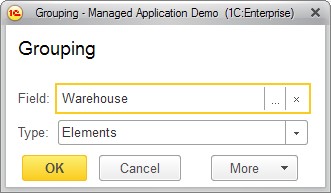
Fig. 106. Selecting a grouping field
Let us filter by the value Goods In group Shoes. The result of the report is shown below:
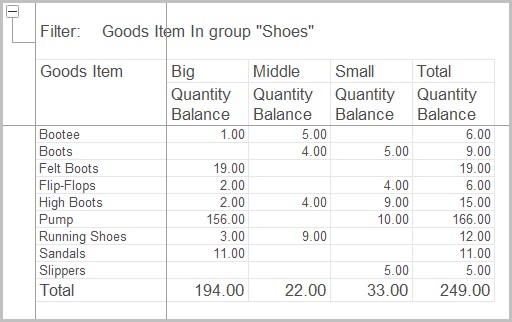
Fig. 107. Result of report grouping
Apply Appearance – makes it possible to specify a condition for an appearance to be applied and customize appearance for the current report item. For example, we should format the fields where Quantity Balance < 10 items.
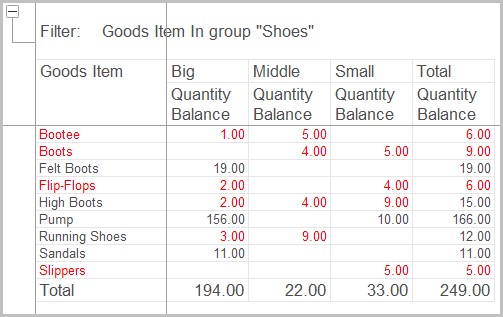
Fig. 108. Report appearance example