The mode of performance meter allows the developer to measure the operation speed both for the entire configuration as a whole and for its individual part. In this mode the frequency of the use of specific code sections and the speed of their execution are measured.
This analysis helps to choose the most optimal way of software implementation of system operation algorithms, as well as to determine the ways to improve the performance of application solution.
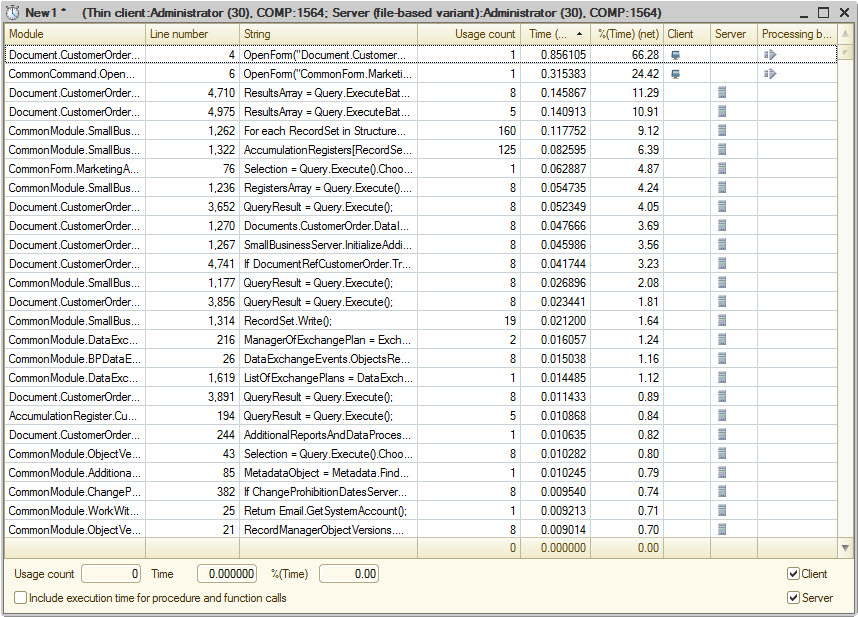
The result of performance measurement is a list of links to the particular module lines with indication of their execution frequency and duration (absolute and relative execution time, in percentage of the total execution time of measured section). Also in list the code lines are marked that were executed on the client side, on the server side, as well as the code lines resulting in a server call:

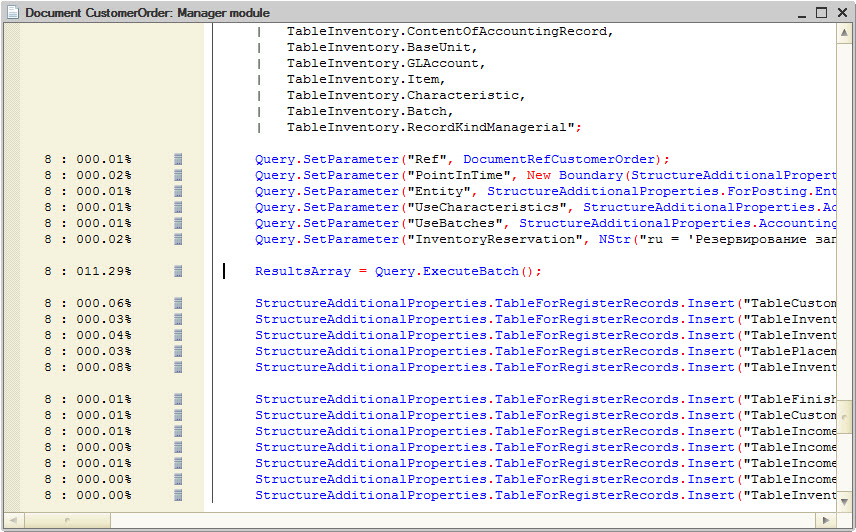
The measurement results can be seen also directly in the window with the module source code. By clicking the mouse on the selected line, it is possible to go to the module text for which in the separate window the number of calls and the relative execution time for each line will be displayed:

The measurement results can be selected by the execution side (client, server, client and server), as well as sorted by any column, for example, by the number of line calls:

In addition, the mode of performance meter allows performing the selective summation of measurement lines in order to receive the summary characteristics of the execution of some lines:

The additional feature is including in measurement or excluding from it the execution time of the called procedures and functions. The use of this feature allows obtaining the measurement map maximally close to the real in case when from the measured module the external subject to it procedures are called.
The developer can save the measurement results in file for the further analysis and comparison with the results of other measurements.
